Volvo 2000 Annual Report Download - page 34
Download and view the complete annual report
Please find page 34 of the 2000 Volvo annual report below. You can navigate through the pages in the report by either clicking on the pages listed below, or by using the keyword search tool below to find specific information within the annual report.-
 1
1 -
2
-
3
-
4
-
5
-
6
-
7
-
8
-
9
-
10
-
11
-
12
-
13
-
14
-
15
-
16
-
17
-
18
-
19
-
20
-
21
-
22
-
23
-
 24
24 -
 25
25 -
 26
26 -
 27
27 -
 28
28 -
 29
29 -
 30
30 -
 31
31 -
 32
32 -
 33
33 -
 34
34 -
 35
35 -
 36
36 -
 37
37 -
 38
38 -
 39
39 -
 40
40 -
 41
41 -
 42
42 -
 43
43 -
 44
44 -
45
-
46
-
47
-
48
-
49
-
50
-
51
-
52
-
53
-
54
-
55
-
56
-
57
-
58
-
59
-
60
-
61
-
62
-
63
-
64
-
65
-
66
-
67
-
68
-
69
-
70
-
71
-
72
-
73
-
74
-
75
-
76
-
77
-
78
-
79
-
80
-
81
-
82
-
83
-
84
-
85
-
86
-
87
-
88
-
89
-
90
-
91
-
92
-
93
-
94
-
95
-
96
-
97
-
98
-
99
-
100
-
101
-
102
-
103
-
104
-
105
-
106
-
107
-
108
-
109
-
110
-
111
-
112
 |
 |

32
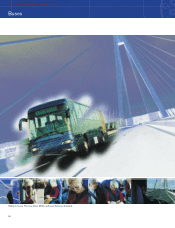
THE VOLVO GROUP YEAR 2000
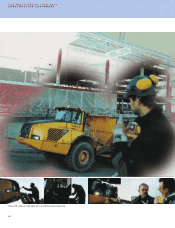
BUSES
Europe and to favorable currency effects. Volvo’s share of the market for heavy buses in
Europe improved to 18% (15%). There was a favorable trend of business in the UK, in particu-
lar, where Volvo regained market shares as a result of new and successfully
launched products. The Nordic markets also showed strong growth. At year-
end, order bookings were 25% lower than on the same date in 1999. Order
bookings in North America, the Middle East and Europe declined, due mainly
to a slower market development and a change in product-generations.
Operating income
Operating income in 2000 nearly doubled to SEK 440 M (224), including a refund from SPP
of SEK 22 M. The higher operating income was a result of increased sales, high utilization of
capacity and positive effects of an improved cost level. The positive trend in Mexico continued
but the demand for coaches weakened in Canada and the U.S. The operating margin increased
to 2.6%, compared with 1.5% in 1999.
Production and investments
During the year Volvo produced 11,244 (10,050) buses and bus chassis, of which 49% were
complete buses. There was a high degree of utilization in the production system in Europe and
North America.
Moving the production in Great Britain to Sweden and Poland continued the consolidation
of the industrial structure. The planned capacity in Poland is 2,500, including 1,100 complete
buses. An expansion of the existing plant in Mexico was inaugurated for the production of the
Volvo 7550 coach model. In June 2000, Volvo Buses signed an agreement with Shanghai
Automotive Industry Corporation to establish a joint-venture company in China for produc-
tion and sales of city and commuter buses. The first bus was produced in September 2000.
Ambitions for 2001
Europe shows a decreasing market in 2001 and the weakening in the U.S. and Canada will con-
tinue. The business activities in China and other parts of Asia will increase during 2001. The
process of exploiting existing strengths and building for the future continues. Key areas in this
process are increased profitability through high quality, reduced product costs based on more
efficient production processes, customer focused sales strategy and improved assets manage-
ment. The future launches of products based on the new modularized TX platform will con-
tinue to support this program.
Strategic development
Volvo Buses has grown rapidly, through organic growth and through several acquisitions and
joint ventures in Europe, North America and Asia. Volvo will continue to exploit the global
presence and the synergies between the different companies and build on common compon-
ents whenever feasible. The products will be further modularized, which will reduce the num-
ber of parts and suppliers drastically. A series of new products based on the TX platform will
follow during the next couple of years and TX modules are planned to be introduced.
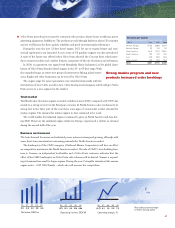
Number of vehicles invoiced Buses
1998 1999 2000
Western Europe 3,580 3,430 3,870
Eastern Europe 280 200 124
North America 2,730 3,640 3,869
South America 1,510 710 980
Asia 1,650 1,000 1,659
Other markets 450 520 513
Total 10,200 9,500 11,015
Largest markets Buses
Volvo buses Market share,
registrations %
1999 2000 1999 2000
Mexico 1,270 1,620 18.5 16.0
United States 11,850 1,520 n/a n/a
Great Britain 790 1,230 28.3 48.6
Brazil 460 610 6.4 6.4
Sweden 470 560 47.3 54.5
1 Deliveries from factory.
Net sales per market Buses
SEK M 1998 1999 2000
Western Europe 5,528 5,735 6,767
Eastern Europe 366 226 182
North America 5,574 6,871 7,723
South America 910 469 732
Asia 1,519 943 1,269
Other markets 389 469 514
Total 14,286 14,713 17,187
Deliveries of buses
and chassis increased by 16%