Volvo 2000 Annual Report Download - page 21
Download and view the complete annual report
Please find page 21 of the 2000 Volvo annual report below. You can navigate through the pages in the report by either clicking on the pages listed below, or by using the keyword search tool below to find specific information within the annual report.-
 1
1 -
2
-
3
-
4
-
5
-
6
-
7
-
8
-
9
-
10
-
 11
11 -
 12
12 -
 13
13 -
 14
14 -
 15
15 -
 16
16 -
 17
17 -
 18
18 -
 19
19 -
 20
20 -
 21
21 -
 22
22 -
 23
23 -
 24
24 -
 25
25 -
 26
26 -
 27
27 -
 28
28 -
 29
29 -
 30
30 -
 31
31 -
32
-
33
-
34
-
35
-
36
-
37
-
38
-
39
-
40
-
41
-
42
-
43
-
44
-
45
-
46
-
47
-
48
-
49
-
50
-
51
-
52
-
53
-
54
-
55
-
56
-
57
-
58
-
59
-
60
-
61
-
62
-
63
-
64
-
65
-
66
-
67
-
68
-
69
-
70
-
71
-
72
-
73
-
74
-
75
-
76
-
77
-
78
-
79
-
80
-
81
-
82
-
83
-
84
-
85
-
86
-
87
-
88
-
89
-
90
-
91
-
92
-
93
-
94
-
95
-
96
-
97
-
98
-
99
-
100
-
101
-
102
-
103
-
104
-
105
-
106
-
107
-
108
-
109
-
110
-
111
-
112
 |
 |
19
THE VOLVO GROUP YEAR 2000
The business environment
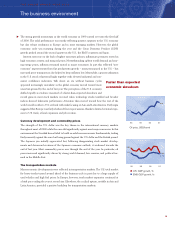
The strong growth momentum in the world economy in 1999 carried over into the first half
of 2000. The solid performance was mostly reflecting positive surprises to the U.S. economy
but also robust conditions in Europe and in most emerging markets. However, the global
economic cycle was maturing during the year and the Gross Domestic Product (GDP)
growth peaked around the second quarter in the U.S., the EMU countries and Japan.
Interest rates rose on the back of tighter monetary policies, inflationary pressures rooted in
high economic activity, and rising oil prices. Notwithstanding upbeat world demand and soar-
ing energy prices, inflation remained muted in major economies. In part this reflected “new
economy” improvements from fast productivity growth – most pronounced in the U.S. – but
increased price transparency also helped to keep inflation low. Meanwhile, capacity utilization
in the U.S. stood at historical highs together with elevated industrial and con-
sumer confidence indicators. Talk about an era without business cycles
appeared increasingly unrealistic as the global economy moved toward more
uncertain ground by the end of last year. The perception of the U.S. economy
shifted rapidly as evidence mounted of a faster-than-expected slowdown and
record gains in most stock markets reversed when technology stocks tumbled and broader
indices showed lukewarm performance. Attention then moved toward how the rest of the
world would weather a U.S. set-back with risks focusing on Asia and Latin America. Early signs
suggested that Europe was fairly sheltered from repercussions, thanks to limited external expo-
sure to U.S. trade, a fiscal expansion and job creation.
Currency development and commodity prices
The strength of the U.S. dollar was the key theme in the international currency markets
throughout most of 2000 while the euro slid significantly against most major currencies. In this
environment the Swedish krona failed to build on solid macroeconomic fundamentals, trading
fairly narrowly against the euro but losing ground against the U.S. dollar and the British pound.
The Japanese yen initially appreciated but, following disappointing stock market develop-
ments and downward revisions of the Japanese economic outlook, it weakened towards the
end of last year. Most commodity prices rose through the end of the year. In particular, oil
prices increased significantly driven by strong world demand, low reserves, and political tur-
moil in the Middle East.
The transportation markets
Macroeconomic developments were reflected in transportation markets. The U.S. total market
for heavy trucks turned around ahead of the business cycle in part due to a large supply of
used vehicles and high fuel prices. In Europe, however, truck market expansion continued at
a brisk pace ending the year at record size. Elsewhere, the cyclical upturn, notably in Asia and
Latin America, provided a positive backdrop for transportation markets.
▲
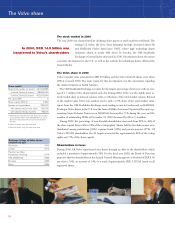
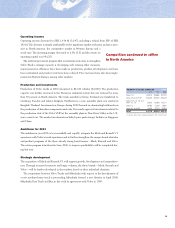
98
U.S. GDP-growth, %
EMU GDP-growth, %
0099
4.8%
3.4%
3.1%
3.4%
01
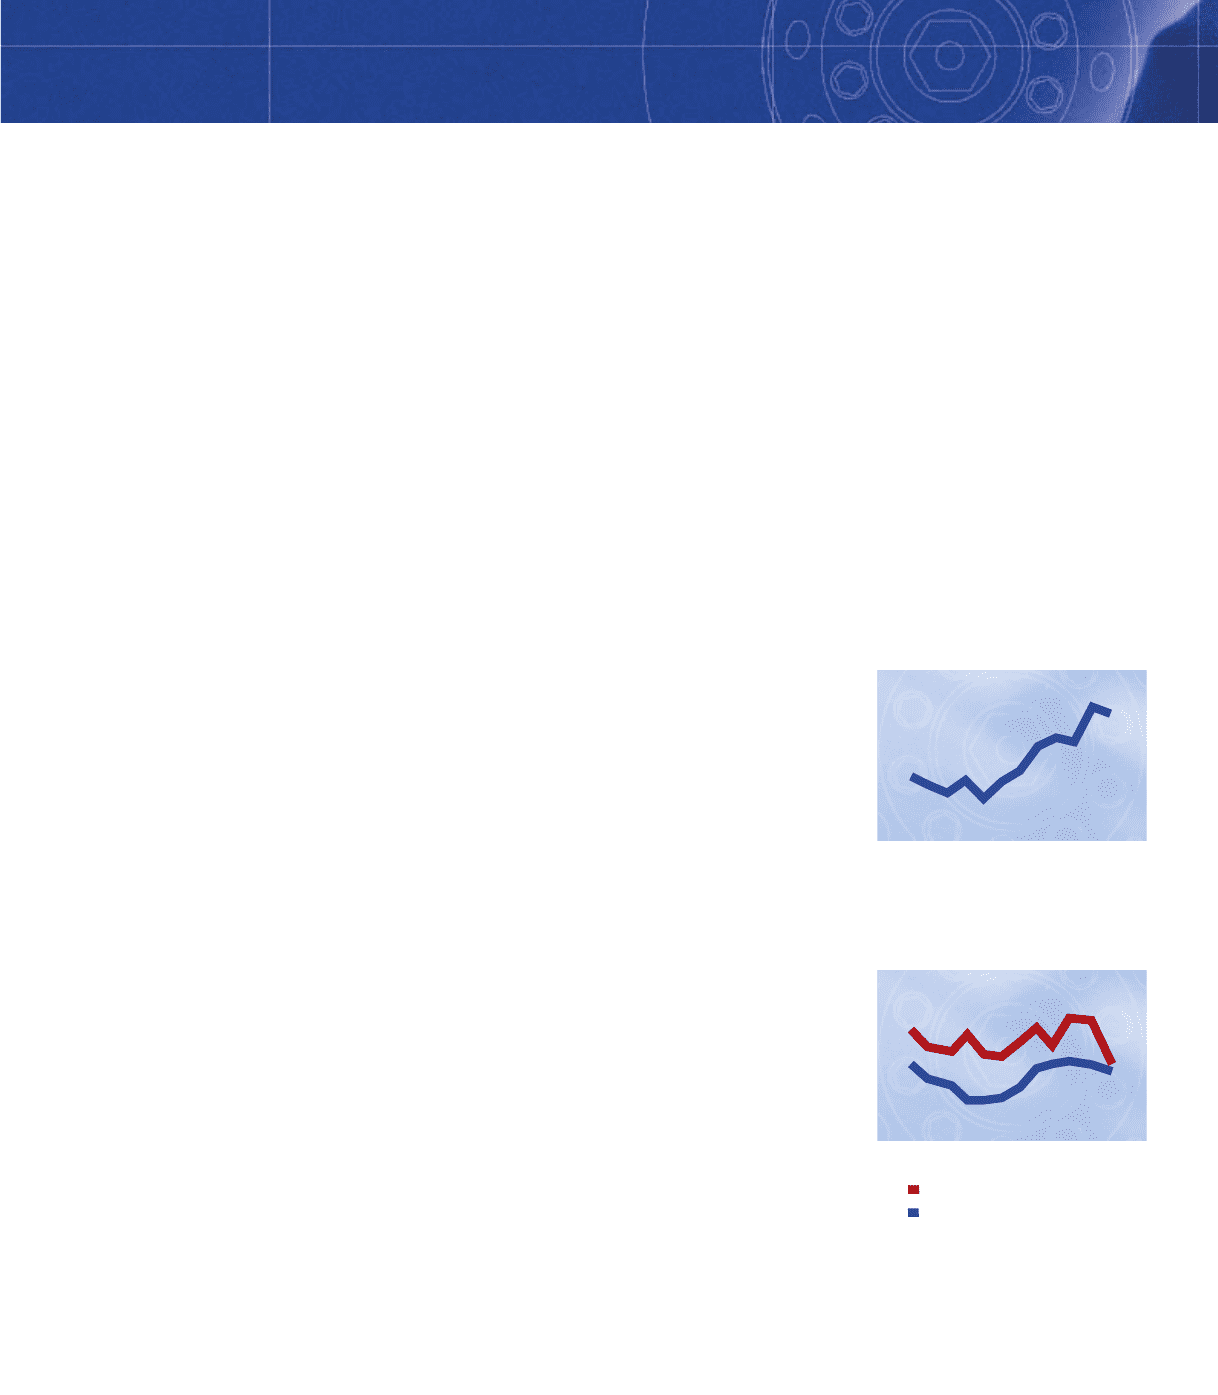
98
Oil price, USD/barrel
0099
15.1
30.6
01
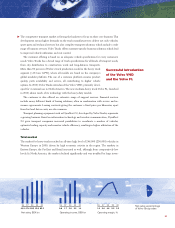
Faster than expected
economic slowdown