Volvo 2000 Annual Report Download - page 24
Download and view the complete annual report
Please find page 24 of the 2000 Volvo annual report below. You can navigate through the pages in the report by either clicking on the pages listed below, or by using the keyword search tool below to find specific information within the annual report.-
 1
1 -
2
-
3
-
4
-
5
-
6
-
7
-
8
-
9
-
10
-
11
-
12
-
13
-
 14
14 -
 15
15 -
 16
16 -
 17
17 -
 18
18 -
 19
19 -
 20
20 -
 21
21 -
 22
22 -
 23
23 -
 24
24 -
 25
25 -
 26
26 -
 27
27 -
 28
28 -
 29
29 -
 30
30 -
 31
31 -
 32
32 -
 33
33 -
 34
34 -
35
-
36
-
37
-
38
-
39
-
40
-
41
-
42
-
43
-
44
-
45
-
46
-
47
-
48
-
49
-
50
-
51
-
52
-
53
-
54
-
55
-
56
-
57
-
58
-
59
-
60
-
61
-
62
-
63
-
64
-
65
-
66
-
67
-
68
-
69
-
70
-
71
-
72
-
73
-
74
-
75
-
76
-
77
-
78
-
79
-
80
-
81
-
82
-
83
-
84
-
85
-
86
-
87
-
88
-
89
-
90
-
91
-
92
-
93
-
94
-
95
-
96
-
97
-
98
-
99
-
100
-
101
-
102
-
103
-
104
-
105
-
106
-
107
-
108
-
109
-
110
-
111
-
112
 |
 |

22
THE VOLVO GROUP YEAR 2000
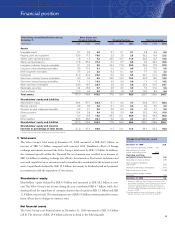
FINANCIAL PERFORMANCE
The effect on income of forward and option contracts amounted to a loss of SEK 700 M
(1999: loss of SEK 620 M), which resulted in a negative impact of SEK 80 M for 2000, com-
pared with 1999.
Changes in spot rates in connection with the translation of income in foreign subsidiaries
and the revaluation of balance sheet items in foreign currencies had a negative impact of SEK
90 M.
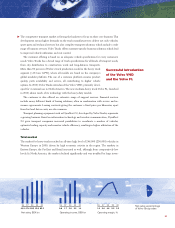
Income from investments in associated companies
Income from investments in associated companies – primarily Scania, Bilia and Volvofinans –
amounted to SEK 444 M (567). On March 14, 2000, the European Commission rejected
Volvo’s application for approval of the company's proposed acquisition of Scania. As a result,
effective in the second quarter of 2000, Volvo’s holding in Scania is no longer reported in
accordance with the equity method. The dividend of SEK 637 M received from Scania in the
second quarter reduced the book value of the holding.
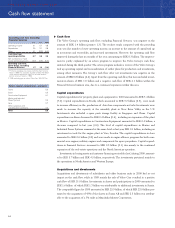
Net interest expense/income
Net interest expense amounted to SEK 257 M (income 307). The decrease was due largely to
lower net financial assets as a result of the repurchase of company shares. Net interest expense
was charged with increased borrowings in Poland. A higher return on financial assets and lower
costs of borrowing in Brazil and South Korea had a positive impact on net interest expense,
compared with the preceding year.
Taxes
Tax expenses amounted to SEK 1,510 M (2,270), corresponding to an average tax rate of 24%
(29% excluding the sale of Volvo Cars). The Volvo Group’s average tax rate during 2000 was
affected favorably by the supplementary payment received for Volvo Cars, for which no
income tax was incurred. In addition, the tax expenses reported during the year were reduced
through revaluation of valuation allowances in prior years for deferred tax receivables. The
reported tax expenses pertained primarily to current taxes in Swedish and foreign Volvo
Group companies.
Minority interests in net income
Minority interests in the Volvo Group consist mainly of the Henlys Group’s holding (49%) in
Prévost Car Inc. and the minority interests in The AGES Group (14%) and Volvo Aero Norge
AS (22%).
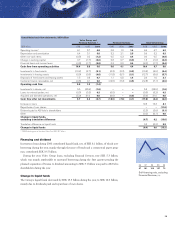
Net income
Net income amounted to SEK 4,709 M (32,222) and the return on equity, excluding items
affecting comparability and gains on the sale of shares, was 5.0% (8.0).
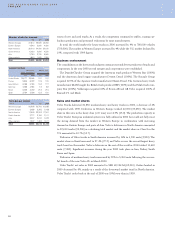
Operating income by business area
SEK M 1998 1999 2000
Trucks 2,815 3,247 1,414
Buses 385 224 440
Construction
Equipment 1,536 1,709 1,594
Marine and Industrial
Power Systems 95 314 484
Aero 527 584 621
Financial Services 590 977 1,396
Other and eliminations (567) (329) 205
Operating income
excluding Cars 5,381 6,726 6,154
Cars 3,808 – –
Operating income 19,189 6,726 6,154
Items affecting
comparability (2,331) 26,695 –
Operating income 6,858 33,421 6,154
1 Excluding items affecting comparability.