Volvo 2000 Annual Report Download - page 22
Download and view the complete annual report
Please find page 22 of the 2000 Volvo annual report below. You can navigate through the pages in the report by either clicking on the pages listed below, or by using the keyword search tool below to find specific information within the annual report.-
 1
1 -
2
-
3
-
4
-
5
-
6
-
7
-
8
-
9
-
10
-
11
-
 12
12 -
 13
13 -
 14
14 -
 15
15 -
 16
16 -
 17
17 -
 18
18 -
 19
19 -
 20
20 -
 21
21 -
 22
22 -
 23
23 -
 24
24 -
 25
25 -
 26
26 -
 27
27 -
 28
28 -
 29
29 -
 30
30 -
 31
31 -
 32
32 -
33
-
34
-
35
-
36
-
37
-
38
-
39
-
40
-
41
-
42
-
43
-
44
-
45
-
46
-
47
-
48
-
49
-
50
-
51
-
52
-
53
-
54
-
55
-
56
-
57
-
58
-
59
-
60
-
61
-
62
-
63
-
64
-
65
-
66
-
67
-
68
-
69
-
70
-
71
-
72
-
73
-
74
-
75
-
76
-
77
-
78
-
79
-
80
-
81
-
82
-
83
-
84
-
85
-
86
-
87
-
88
-
89
-
90
-
91
-
92
-
93
-
94
-
95
-
96
-
97
-
98
-
99
-
100
-
101
-
102
-
103
-
104
-
105
-
106
-
107
-
108
-
109
-
110
-
111
-
112
 |
 |
20
Net sales
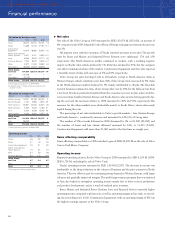
Net sales of the Volvo Group in 2000 amounted to SEK 130,070 M (125,019), an increase of
4% compared with 1999.Adjusted for the effects of foreign exchange movements, the increase
was 2%.
All business areas with the exception of Trucks reported increases in net sales. The growth
rates for Buses and Marine and Industrial Power Systems were substantial, 17% and 15%
respectively. The North American market continued to weaken, with a resulting negative
impact on Trucks’ sales, which declined by 1%. Deliveries declined by 31%, but the company
was able to maintain its share of the market. Construction Equipment and Aero also reported
a favorable trend of sales with increases of 6% and 8%, respectively.
Volvo Group net sales developed well in all markets, except in North America. Sales in
Western Europe, which constitute more than 50% of the Group total, increased by 3%. Sales
in the North American market declined by 5%, mainly attributable to Trucks. The favorable
trend of business continued in Asia, where Group sales rose by 45% for the full year, but from
a low level. Trucks, in particular, benefited from the economic recovery in Asia, where its deliv-
eries more than doubled. Eastern Europe and South America also reported strong growth dur-
ing the year and the increases relative to 1999 amounted to 36% and 31%, respectively. The
increases for the other markets were attributable mainly to South Africa, where sales nearly
tripled during the year.
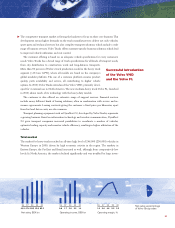
The percentage of net sales attributable to Volvo’s growth markets – Asia, Eastern Europe
and South America – continued to increase and amounted to 14% (10) of Group sales.
The number of Volvo trucks delivered in 2000 decreased by 4%, to 81,830 (85,090) and
the number of buses and bus chassis delivered increased by 16%, to 11,015 (9,500).
Construction Equipment sold more than 21,000 units for the first time in a single year.
Items affecting comparability
Items affecting comparability in 1999 included a gain of SEK 26,695 M on the sale of Volvo
Cars to Ford Motor Company.
Operating income
Reported operating income for the Volvo Group in 2000 amounted to SEK 6,154 M (1999:
SEK 6,726 M, excluding the sale of Volvo Cars).
Trucks’ operating income amounted to SEK 1,414 M (3,247). The decrease in income was
attributable to the sharp reduction in the volume of business and the price pressure in North
America. This was offset in part by continuing strong demand in Western Europe, with larger
volumes and gradually improved margins. The profit improvement program that was initiated
in June also helped to strengthen operating income mainly due to lower costs in production
and product development, and as a result of realized price increases.
Buses, Marine and Industrial Power Systems, Aero and Financial Services reported higher
operating income compared with last year, as well as operating margins in line with, or exceed-
ing, the preceding year’s levels. Construction Equipment, with an operating margin of 8%, has
the highest earnings capacity in the Volvo Group.
THE VOLVO GROUP YEAR 2000
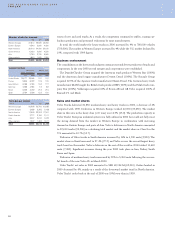
Financial performance
▲
Net sales by market area
SEK M 1998 1999 2000 %1
Western Europe 59,621 66,158 68,182 3
Eastern Europe 4,160 2,899 3,933 36
North America 35,857 43,002 40,655 (5)
South America 6,636 3,942 5,182 31
Asia 5,490 6,028 8,765 45
Other markets 3,090 2,990 3,353 12
Volvo Group
excl Cars 114,854 125,019 130,070 4
Cars 98,082 – ––
Total 212,936 125,019 130,070 –
1 Percentage change pertains to 2000/1999.
Operating margin1
% 1998 1999 2000
Trucks 4.8 5.2 2.3
Buses 2.7 1.5 2.6
Construction Equipment 7.9 9.1 8.0
Marine and Industrial
Power Systems 1.9 5.5 7.3
Aero 6.1 5.9 5.8
Financial Services 8.2 11.3 14.4
Volvo Group
excl Cars 4.7 5.4 4.7
Cars 3.7 – –
Total 4.3 5.4 4.7
1 Excluding items affecting comparability
Net sales by business area
SEK M 1998 1999 2000 %1
Trucks 58,505 63,010 62,196 (1)
Buses 14,286 14,713 17,187 +17
Construction
Equipment 19,372 18,882 19,993 +6
Marine and Industrial
Power Systems 4,931 5,761 6,599 +15
Aero 8,584 9,953 10,713 +8
Financial Services 7,224 8,637 9,678 +12
Other 9,977 11,934 12,669 +6
Eliminations (8,025) (7,871) (8,965) –
Volvo Group
excl Cars 114,854 125,019 130,070 +42
Cars 103,798 – ––
Eliminations (5,716) – ––
Volvo Group 212,936 125,019 130,070 –
1 Percentage change pertains to 2000/1999.
2 Excluding effects of foreign exchange movements the
increase was 2%.