Volvo 2000 Annual Report Download - page 106
Download and view the complete annual report
Please find page 106 of the 2000 Volvo annual report below. You can navigate through the pages in the report by either clicking on the pages listed below, or by using the keyword search tool below to find specific information within the annual report.-
 1
1 -
2
-
3
-
4
-
5
-
6
-
7
-
8
-
9
-
10
-
11
-
12
-
13
-
14
-
15
-
16
-
17
-
18
-
19
-
20
-
21
-
22
-
23
-
24
-
25
-
26
-
27
-
28
-
29
-
30
-
31
-
32
-
33
-
34
-
35
-
36
-
37
-
38
-
39
-
40
-
41
-
42
-
43
-
44
-
45
-
46
-
47
-
48
-
49
-
50
-
51
-
52
-
53
-
54
-
55
-
56
-
57
-
58
-
59
-
60
-
61
-
62
-
63
-
64
-
65
-
66
-
67
-
68
-
69
-
70
-
71
-
72
-
73
-
74
-
75
-
76
-
77
-
78
-
79
-
80
-
81
-
82
-
83
-
84
-
85
-
86
-
87
-
88
-
89
-
90
-
91
-
92
-
93
-
94
-
95
-
 96
96 -
 97
97 -
 98
98 -
 99
99 -
 100
100 -
 101
101 -
 102
102 -
 103
103 -
 104
104 -
 105
105 -
 106
106 -
 107
107 -
 108
108 -
 109
109 -
 110
110 -
 111
111 -
 112
112
 |
 |
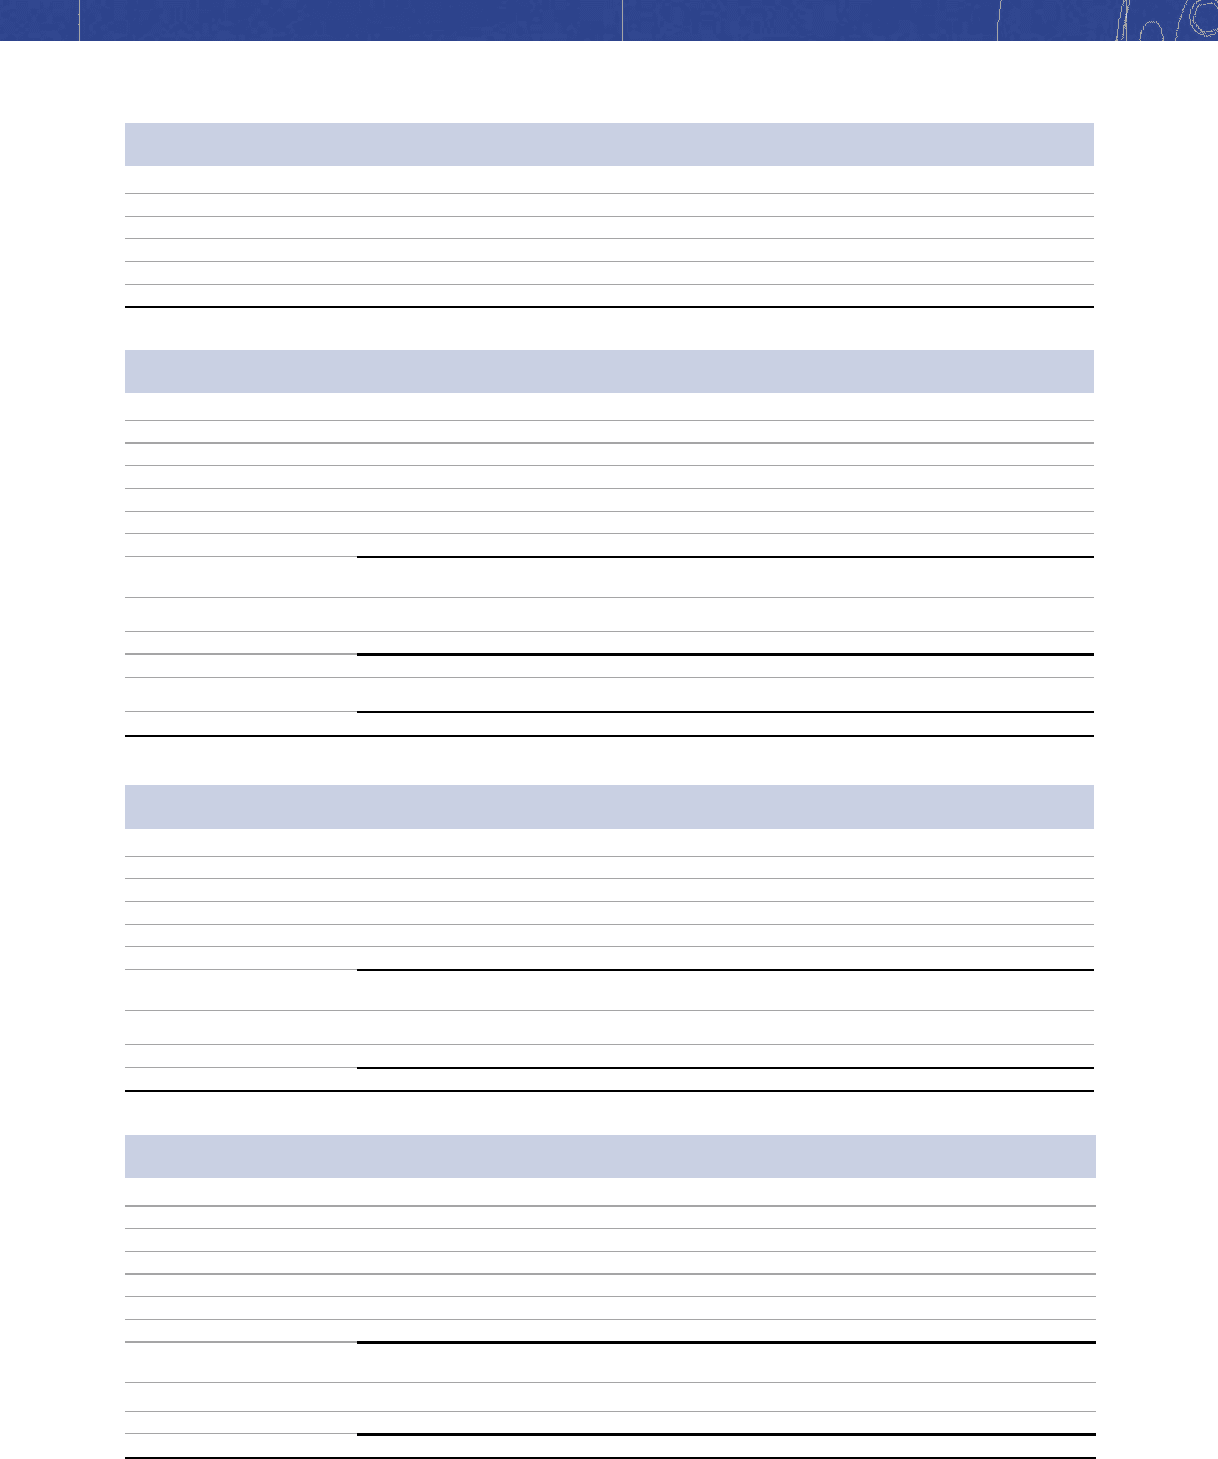
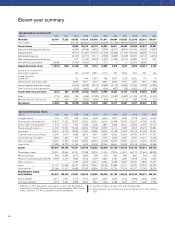
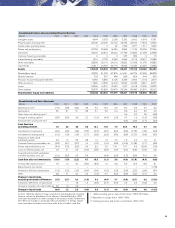
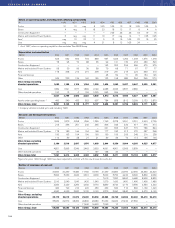
ELEVEN-YEAR SUMMARY
104
Research and development expenses
SEK M 1990 1991 1992 1993 1994 1995 1996 1997 1998 1999 2000
Trucks 1,525 1,870 2,258 1,365 1,399 1,760 2,078 2,051 2,301 2,524 2,709
Buses 213 256 251 240 265 306 343 434 617 576 614
Construction Equipment — ————221555627715786844
Marine and Industrial Power Systems 178 180 166 154 148 177 183 213 270 287 368
Aero 150 163 194 196 160 150 155 205 248 216 238
Other 114 50 28 21 21 30 36 74 114 136 104
Volvo Group excluding
divested operations 2,180 2,519 2,897 1,976 1,993 2,644 3,350 3,604 4,265 4,525 4,877
Cars 4,851 3,895 3,346 2,462 2,502 4,561 4,901 5,055 5,839 — –
Other divested operations 30 ———15713820———–
Volvo Group total 7,061 6,414 6,243 4,438 4,652 7,343 8,271 8,659 10,104 4,525 4,877
Figures for years 1992 through 1996 have been adjusted to conform with the new Annual Accounts Act.
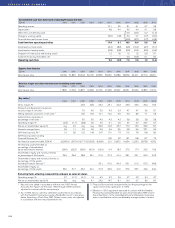
Depreciation and amortization
SEK M 1990 1991 1992 1993 1994 1995 1996 1997 1998 1999 2000
Trucks 523 532 594 704 839 937 1,023 1,252 1,493 1,375 1,478
Buses 78 95 70 88 65 99 121 136 218 280 320
Construction Equipment – ––––143302394996475579
Marine and Industrial Power Systems 58 30 95 36 58 70 68 71 67 77 77
Aero 178 208 214 216 209 219 231 215 224 333 410
Financial Services 45 59 71 95 134 145
Other 245 320 136 160 155 123 158 288 354 365 372
Volvo Group excluding
divested operations 1,082 1,185 1,109 1,204 1,326 1,636 1,962 2,427 3,447 3,039 3,381
Cars 1,389 1,591 1,577 1,869 2,149 2,283 2,345 2,557 2,880 – –
Other divested operations 150 13 0 152 1,025 953 206 – – – –
2,621 2,789 2,686 3,225 4,500 4,872 4,513 4,984 6,327 3,039 3,381
Assets under operating leases 1400 340 433 552 607 784 838 1,812 3,299 2,132 2,870
Volvo Group, total 3,021 3,129 3,119 3 ,777 5,107 5,656 5,351 6,796 9,626 5,171 6,251
1 Company vehicles included up to and including 1993.
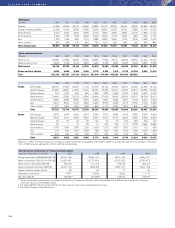
Return on operating capital, excluding items affecting comparability
% 1990 1991 1992 1993 1994 1995 1996 1997 1998 1999 2000
Trucks 21 12 neg 8 >25 >25 10 18 >25 >25 9
Buses 4 neg 5 18 22 18 12 17 8 4 6
Construction Equipment — — — — — >25 23 23 18 19 16
Marine and Industrial Power Systems 5 neg neg 11 19 17 neg 14 7 >25 >25
Aero1neg 12 22 11 5 13 19 >25 23 19 25
Cars neg neg neg 4 21 8 12 >25 24 – –
1 As of 1997, return on operating capital for Aero excludes The AGES Group.
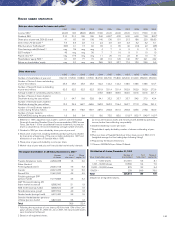
Number of employees at year-end
Number 1990 1991 1992 1993 1994 1995 1996 1997 1998 1999 2000
Trucks 20,550 20,290 19,480 17,780 19,790 21,450 20,860 22,090 22,560 23,330 24,320
Buses 3,690 3,050 2,620 2,610 2,600 3,620 3,750 4,220 8,690 8,860 9,060
Construction Equipment — ————7,610 7,300 8,550 9,680 8,900 8,830
Marine and Industrial Power Systems 2,190 2,040 1,540 1,420 1,540 1,570 1,420 1,400 1,490 1,400 1,480
Aero 4,000 4,420 4,290 4,040 3,770 3,890 3,740 4,170 3,990 4,550 4,240
Financial Services 400 190 210 220 230 450 560 710 860 1,160 1,220
Other 4,340 4,020 3,530 3,130 2,120 2,370 3,090 3,840 5,190 5,270 5,120
Volvo Group, excluding
divested operations 35,170 34,010 31,670 29,200 30,050 40,960 40,720 44,980 52,460 53,470 54,270
Cars 33,630 29,570 28,450 26,800 29,080 31,050 29,600 27,920 27,360 — –
Other divested operations — — — 17,640 16,420 7,040 10———–
Volvo Group, total 68,800 63,580 60,120 73,640 75,550 79,050 70,330 72,900 79,820 53,470 54,270