Volvo 2000 Annual Report Download - page 77
Download and view the complete annual report
Please find page 77 of the 2000 Volvo annual report below. You can navigate through the pages in the report by either clicking on the pages listed below, or by using the keyword search tool below to find specific information within the annual report.-
 1
1 -
2
-
3
-
4
-
5
-
6
-
7
-
8
-
9
-
10
-
11
-
12
-
13
-
14
-
15
-
16
-
17
-
18
-
19
-
20
-
21
-
22
-
23
-
24
-
25
-
26
-
27
-
28
-
29
-
30
-
31
-
32
-
33
-
34
-
35
-
36
-
37
-
38
-
39
-
40
-
41
-
42
-
43
-
44
-
45
-
46
-
47
-
48
-
49
-
50
-
51
-
52
-
53
-
54
-
55
-
56
-
57
-
58
-
59
-
60
-
61
-
62
-
63
-
64
-
65
-
66
-
 67
67 -
 68
68 -
 69
69 -
 70
70 -
 71
71 -
 72
72 -
 73
73 -
 74
74 -
 75
75 -
 76
76 -
 77
77 -
 78
78 -
 79
79 -
 80
80 -
 81
81 -
 82
82 -
 83
83 -
 84
84 -
 85
85 -
 86
86 -
 87
87 -
88
-
89
-
90
-
91
-
92
-
93
-
94
-
95
-
96
-
97
-
98
-
99
-
100
-
101
-
102
-
103
-
104
-
105
-
106
-
107
-
108
-
109
-
110
-
111
-
112
 |
 |
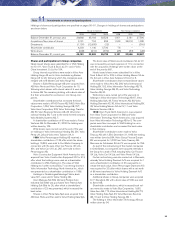
75
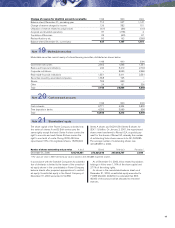
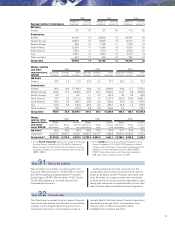
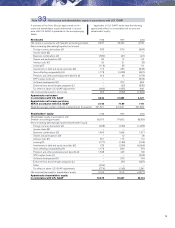
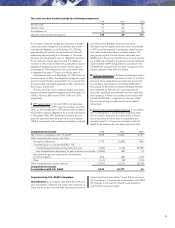
A summary of the Volvo Group’s approximate net in-
come and shareholders’ equity determined in accord-
ance with U.S. GAAP, is presented in the accompanying
tables.
Application of U.S. GAAP would have the following
approximate effect on consolidated net income and
shareholders’ equity:
Net income 1998 1999 2000
Net income in accordance with Swedish accounting principles 8,437 32,222 4,709
Items increasing (decreasing) reported net income
Foreign currency derivatives (A) 535 576 (654)
Income taxes (B) – – –
Business combinations (C) (530) (91) (91)
Shares and participations (D) 90 12 24
Interest costs (E) 20 21 (3)
Leasing (F) (118) 39 16
Investments in debt and equity securities (G) 116 253 (548)
Items affecting comparability (H) 1,178 (1,325) (281)
Pensions and other post-employment benefits (I) 313 40 (170)
SPP surplus funds (J) – – (523)
Software development (K) – 370 384
Entrance fees, aircraft engine programs (L) – (22) (336)
Tax effect of above U.S. GAAP adjustments (609) (405) 600
Net increase (decrease) in net income 995 (532) (1,582)
Approximate net income
in accordance with U.S. GAAP 9,432 31,690 3,127
Approximate net income per share,
SEK in accordance with U.S. GAAP 21.40 71.80 7.40
Weighted average number of shares outstanding (in thousands) 441,521 441,521 421,684
Shareholders’ equity 1998 1999 2000
Shareholders’ equity in accordance with
Swedish accounting principles 69,375 97,692 88,338
Items increasing (decreasing) reported shareholders’ equity
Foreign currency derivatives (A) (628) (632) (1,286)
Income taxes (B) – – —
Business combinations (C) 1,499 1,408 1,317
Shares and participations (D) – 12 36
Interest costs (E) 551 115 112
Leasing (F) (177) (189) (163)
Investments in debt and equity securities (G) 133 (256) (6,066)
Items affecting comparability (H) 1,178 860 579
Pensions and other postemployment benefits (I) 1,548 443 109
SPP surplus funds (J) – – (523)
Software development (K) – 370 754
Entrance fees, aircraft engine programs (L) – (51) (387)
Other (226) – –
Tax effect of above U.S. GAAP adjustments (774) (165) 1,941
Net increase (decrease) in shareholders’ equity 3,104 1,915 (3,577)
Approximate shareholders’ equity
in accordance with U.S. GAAP 72,479 99,607 84,761
Note 33 Net income and shareholders’ equity in accordance with U.S. GAAP