Volvo 2000 Annual Report Download - page 33
Download and view the complete annual report
Please find page 33 of the 2000 Volvo annual report below. You can navigate through the pages in the report by either clicking on the pages listed below, or by using the keyword search tool below to find specific information within the annual report.-
 1
1 -
2
-
3
-
4
-
5
-
6
-
7
-
8
-
9
-
10
-
11
-
12
-
13
-
14
-
15
-
16
-
17
-
18
-
19
-
20
-
21
-
22
-
 23
23 -
 24
24 -
 25
25 -
 26
26 -
 27
27 -
 28
28 -
 29
29 -
 30
30 -
 31
31 -
 32
32 -
 33
33 -
 34
34 -
 35
35 -
 36
36 -
 37
37 -
 38
38 -
 39
39 -
 40
40 -
 41
41 -
 42
42 -
 43
43 -
44
-
45
-
46
-
47
-
48
-
49
-
50
-
51
-
52
-
53
-
54
-
55
-
56
-
57
-
58
-
59
-
60
-
61
-
62
-
63
-
64
-
65
-
66
-
67
-
68
-
69
-
70
-
71
-
72
-
73
-
74
-
75
-
76
-
77
-
78
-
79
-
80
-
81
-
82
-
83
-
84
-
85
-
86
-
87
-
88
-
89
-
90
-
91
-
92
-
93
-
94
-
95
-
96
-
97
-
98
-
99
-
100
-
101
-
102
-
103
-
104
-
105
-
106
-
107
-
108
-
109
-
110
-
111
-
112
 |
 |

31
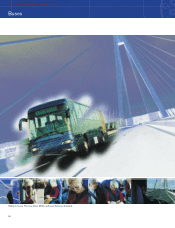
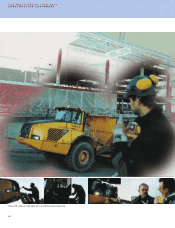
Volvo Buses’ product line comprises complete buses, bus chassis and bodies for various appli-
cations – city and intercity buses and coaches – and also in more specifically adapted forms
such as mobile homes. The passenger capacity varies from 24 – in a luxury tourist coach – to
270 in a bi-articulated intercity bus. The customers are mainly bus operators throughout the
world, with vehicle fleets ranging from a single bus to as many as 20,000.
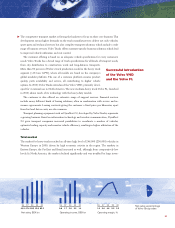
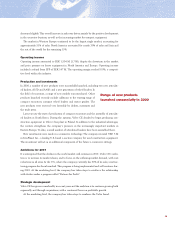
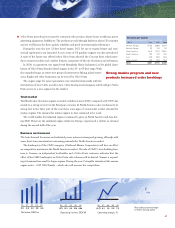
During the autumn of 2000, Volvo Buses launched a new global product
program for coaches and intercity buses based on the new TX platform. The
TX platform enables a more effective production process which requires
about 40% fewer components, while the number of model versions and customer value are
increased.
Volvo Buses offers traditional financial solutions and service contracts. In cooperation with
Volvo Mobility, the customer offering is extended to complete system solutions including
traffic planning, design of infrastructures, support systems (ticket systems, traffic management,
information and follow-up systems) and system implementation.
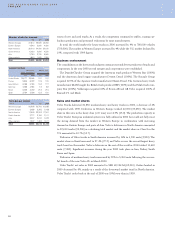
Total market
The overall market for heavy buses increased during 2000. The growth is attributable mainly
to the recovering economic situation in Mexico and Brazil. European volumes remained
steady, while the North American market rose by 27%, despite the deteriorating market con-
ditions in the U.S. and Canada. Driven by the Brazilian market, the South American market
rose 20%. The world’s largest bus markets, China and India, dominated by local designs,
increased by approximately 18% and 11%, respectively.
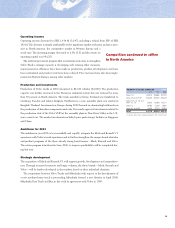
Business environment
The ongoing liberalization of city bus traffic contributes to the creation of larger and more pro-
fessional operators. Competition among these often privately owned operators increases as
they internationalize and compete for contracts. The requirements placed on bus manufactur-
ers and products are increasing, with demands for lower fuel consumption, lower operating
costs and more complete offerings, including IT-based solutions for both operational and traf-
fic planning.
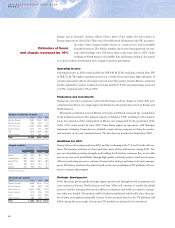
Sales and market shares
Volvo delivered 11,015 buses and bus chassis during 2000, 16% more than in 1999. Volvo
Buses’ net sales increased to SEK 17,187 M (14,713), attributable to increased volumes in
▲
96 97 98 99 00
Net sales, SEK bn
8.5 10.6 14.3 14.7 17.2
96 97 98 99 00
Operating margin, %
3.9 5.2 2.7 1.5 2.6
96 97 98 99 00
Operating income, SEK M
331 550 385 224 440
Net sales as percentage
of Volvo Group sales
13 %
New modularized TX platform
increases capacity