Volvo 2000 Annual Report Download - page 60
Download and view the complete annual report
Please find page 60 of the 2000 Volvo annual report below. You can navigate through the pages in the report by either clicking on the pages listed below, or by using the keyword search tool below to find specific information within the annual report.-
 1
1 -
2
-
3
-
4
-
5
-
6
-
7
-
8
-
9
-
10
-
11
-
12
-
13
-
14
-
15
-
16
-
17
-
18
-
19
-
20
-
21
-
22
-
23
-
24
-
25
-
26
-
27
-
28
-
29
-
30
-
31
-
32
-
33
-
34
-
35
-
36
-
37
-
38
-
39
-
40
-
41
-
42
-
43
-
44
-
45
-
46
-
47
-
48
-
49
-
 50
50 -
 51
51 -
 52
52 -
 53
53 -
 54
54 -
 55
55 -
 56
56 -
 57
57 -
 58
58 -
 59
59 -
 60
60 -
 61
61 -
 62
62 -
 63
63 -
 64
64 -
 65
65 -
 66
66 -
 67
67 -
 68
68 -
 69
69 -
 70
70 -
71
-
72
-
73
-
74
-
75
-
76
-
77
-
78
-
79
-
80
-
81
-
82
-
83
-
84
-
85
-
86
-
87
-
88
-
89
-
90
-
91
-
92
-
93
-
94
-
95
-
96
-
97
-
98
-
99
-
100
-
101
-
102
-
103
-
104
-
105
-
106
-
107
-
108
-
109
-
110
-
111
-
112
 |
 |
THE VOLVO GROUP
NOTES TO CONSOLIDATED FINANCIAL STATEMENTS
58
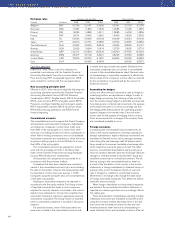
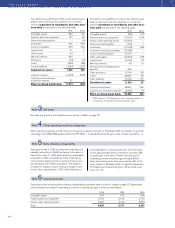
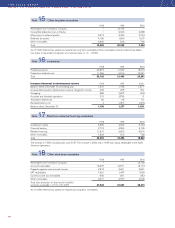
Net sales per business and market area are shown in tables on page 20.
Other operating expenses include losses on forward and options contracts of 700 (620; 640), amortization of goodwill
amounting to 491 (398; 338), surplus funds from SPP 683 (–; –) and adjustment of the gain on sale of Volvo Cars 520 (–; –).
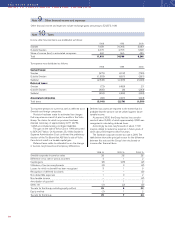
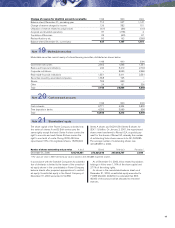
Operating income in 1999 included items affecting com-
parability amounting to 26,695 pertaining to the gain on
sale of Volvo Cars. In 1998, items affecting comparability
amounted to 2,331 and pertained to the restructuring
costs aimed at adapting Volvo’s industrial structure and
the distribution and market organization. The adaption
included, for example, closure, moving or merger of pro-
duction sites. Approximately 1,300 of the total amount
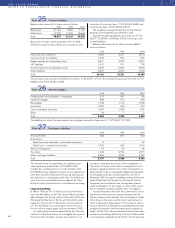
1998 1999 2000
Intangible assets 574 525 648
Property, plant and equipment 5,753 2,514 2,733
Assets under operating leases 3,299 2,132 2,870
Total 9,626 5,171 6,251
Operating income excluding items affecting comparability by business area is shown in a table on page 22. Depreciation
and amortization is included in operating income and is specified by type of asset as shown below:
was attributable to contractual pensions and excess per-
sonnel, approximately 600 to writedowns of assets, 348
in capital gain on the sale of Trucks’ rear-axle plant in
Lindesberg and the remainder, approximately 800 to
other restructuring costs. Cars accounted for 681 of the
costs, Trucks for 46, Buses 422, Construction Equipment
910, Marine and Industrial Engines 158 and other oper-
ations for 114.
Note 3Net sales
Note 4Other operating income and expenses
Note 5Items affecting comparability
Note 6Operating income
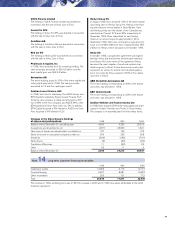
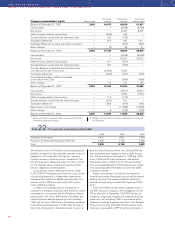
The effects during 2000 and 1999 on the Volvo Group’s
balance sheet and cash flow statement in connection
with the acquisition of subsidiaries and other busi-
ness units are specified in the following table:
1999 2000
Intangible assets 480 125
Property, plant and equipment 147 68
Shares and participations – (9)
Inventories 365 348
Current receivables 233 300
Liquid funds 51 2
Other assets 43 1
Minority interests 335 –
Provisions (72) (7)
Loans (256) (89)
Current liabilities (264) (237)
Acquired net assets 1,062 502
Liquid funds paid (1,062) (502)
Liquid funds according to
acquisition analysis 51 2
Effect on Group liquid funds (1,011) (500)
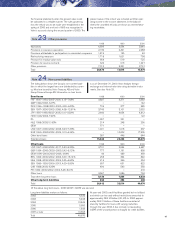
The effects during 2000 and 1999 on the Volvo Group’s
balance sheet and cash flow statement in connection
with the divestment of subsidiaries and other busi-
ness units are specified in the following table:
1999 2000
Intangible assets (46) (17)
Property, plant and equipment (17,915) (132)
Assets under operating leases (12,324) –
Shares and participations (100) 7
Inventories (11,600) (69)
Customer-financing receivables (19,288) –
Loans to external parties 110,474 –
Other receivables (13,203) (93)
Liquid funds (1,602) (7)
Minority interests 49 10
Provisions for postemployment
benefits 866 –
Other provisions 11,054 158
Loans 28,682 38
Other liabilities 17,622 172
Divested net assets (7,331) 67
Liquid funds received 33,661 506
Liquid funds, divested companies (1,602) (7)
Effect on Group liquid funds 32,059 499
1 1999: Of which, 12,214 pertains to the outstanding portion of
consideration to be paid discounted to present value.