Volvo 2000 Annual Report Download - page 107
Download and view the complete annual report
Please find page 107 of the 2000 Volvo annual report below. You can navigate through the pages in the report by either clicking on the pages listed below, or by using the keyword search tool below to find specific information within the annual report.-
 1
1 -
2
-
3
-
4
-
5
-
6
-
7
-
8
-
9
-
10
-
11
-
12
-
13
-
14
-
15
-
16
-
17
-
18
-
19
-
20
-
21
-
22
-
23
-
24
-
25
-
26
-
27
-
28
-
29
-
30
-
31
-
32
-
33
-
34
-
35
-
36
-
37
-
38
-
39
-
40
-
41
-
42
-
43
-
44
-
45
-
46
-
47
-
48
-
49
-
50
-
51
-
52
-
53
-
54
-
55
-
56
-
57
-
58
-
59
-
60
-
61
-
62
-
63
-
64
-
65
-
66
-
67
-
68
-
69
-
70
-
71
-
72
-
73
-
74
-
75
-
76
-
77
-
78
-
79
-
80
-
81
-
82
-
83
-
84
-
85
-
86
-
87
-
88
-
89
-
90
-
91
-
92
-
93
-
94
-
95
-
96
-
 97
97 -
 98
98 -
 99
99 -
 100
100 -
 101
101 -
 102
102 -
 103
103 -
 104
104 -
 105
105 -
 106
106 -
 107
107 -
 108
108 -
 109
109 -
 110
110 -
 111
111 -
 112
112
 |
 |
105
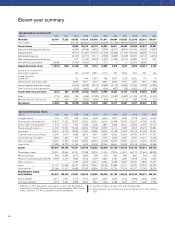
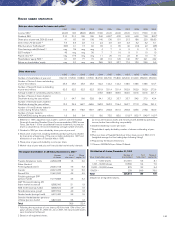
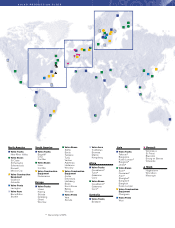
Net sales
SEK M 1990 1991 1992 1993 1994 1995 1996 1997 1998 1999 2000
Western Europe 29,669 29,045 32,018 40,695 45,059 45,994 48,651 59,621 66,158 68,182
Eastern Europe 560 536 666 1,100 1,512 1,906 2,769 4,160 2,899 3,933
Europe total 30,229 29,581 32,684 41,795 46,571 47,900 51,420 63,781 69,057 72,115
North America 7,425 8,625 14,052 16,521 17,516 15,783 25,208 35,857 43,002 40,655
South America 2,303 2,296 4,102 5,859 6,289 4,455 6,510 6,636 3,942 5,182
Asia 4,119 2,932 3,693 4,013 5,128 5,290 5,936 5,490 6,028 8,765
Other markets 1,370 1,415 1,787 1,765 1,816 2,489 3,138 3,090 2,990 3,353
Volvo Group excl
divested operations 45,515 45,446 44,849 56,318 69,953 77,320 75,917 92,212 114,854 125,019 130,070
Cars 39,569 37,022 44,598 58,158 73,598 83,340 83,589 96,453 103,798 — –
Other divested operations
and eliminations (1,899) (5,245) (6,445) (3,321) 12,315 10,851 (3,446) (5,040) (5,716) — –
Volvo Group total 83,185 77,223 83,002 111,155 155,866 171,511 156,060 183,625 212,936 125,019 130,070
of which, Sweden 10,240 10,034 10,573 12,625 13,099 10,748 10,029 10,762 12,278 14,040 15,670
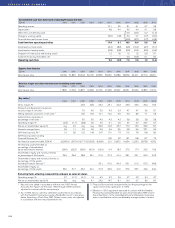
MARKETAREASTATISTICS
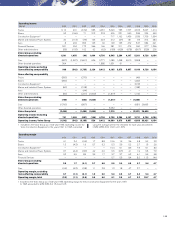
Capital expenditures
SEK M 1990 1991 1992 1993 1994 1995 1996 1997 1998 1999 2000
Trucks 1,073 786 912 725 979 2,063 2,576 2,397 2,552 2,468 3,175
Buses 116 114 101 64 54 124 199 276 320 571 364
Construction Equipment —————204286484630566397
Marine and Industrial Power Systems 43 36 24 35 96 79 67 86 133 126 134
Aero 156 258 199 157 170 180 173 413 448 793 614
Financial Services 79 166 253 329 140 302
Other and corporate
capital expenditures 159 267 117 412 227 317 250 410 512 508 444
Volvo Group 11,547 1,461 1,353 1,393 1,526 3,046 3,717 4,319 4,924 5,172 5,430
Cars 3,051 1,413 1,562 2,072 1,596 2,540 4,425 5,544 5,625 — –
Other divested operations ————1,152 905 58 — — — –
Volvo Group total 4,598 2,874 2,915 3,465 4,274 6,491 8,200 9,863 10,549 5,172 5,430
Assets under operating leases 1900 700 888 1,000 1,255 1,655 2,369 3,290 4,816 5,578 5,709
Divested operations 300 300 464 678 1,240 930 1,482 6,483 7,838 – –
Volvo Group total 21,200 1,000 1,352 1,678 2,495 2,585 3,851 9,773 12,654 5,578 5,709
1 Excluding divested operations. 2 Until 1996 including company vehicles.
Effective in 1997, The Volvo Group’s accounting per market area reflects geographical definitions on an ISO standard.
The accounting for the years 1991–1996 has been adjusted to conform with the new principle.
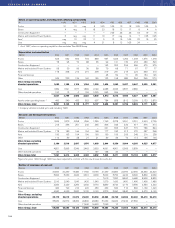
Capital expenditures
SEK M 1990 1991 1992 1993 1994 1995 1996 1997 1998 1999 2000
Sweden 577 1,081 1,004 970 824 1,962 2,333 2,558 2,622 1,789 2,453
Europe, excluding Sweden 693 192 230 264 279 421 608 609 913 966 985
North America 191 125 55 96 331 502 558 601 735 1,425 1,538
South America 3 414 371 512 237
Asia 3 102 230 441 187
Other markets 86 63 64 63 92 161 212 35 53 39 30
Volvo Group 11,547 1,461 1,353 1,393 1,526 3,046 3,717 4,319 4,924 5,172 5,430
Cars 3,051 1,413 1,562 2,072 1,596 2,540 4,425 5,544 5,625 — –
Other divested operations ————1,152 905 58 — — — –
Volvo Group total 4,598 2,874 2,915 3,465 4,274 6,491 8,200 9,863 10,549 5,172 5,430
Assets under operating leases 1900 700 888 1,000 1,255 1,655 2,369 3,290 4,816 5,578 5,709
Divested operations 300 300 464 678 1,240 930 1,482 6,483 7,838 – –
Volvo Group total 21,200 1,000 1,352 1,678 2,495 2,585 3,851 9,773 12,654 5,578 5,709
1 Excluding divested operations. 2 Until 1996 including company vehicles.