Volvo 2000 Annual Report Download - page 108
Download and view the complete annual report
Please find page 108 of the 2000 Volvo annual report below. You can navigate through the pages in the report by either clicking on the pages listed below, or by using the keyword search tool below to find specific information within the annual report.-
 1
1 -
2
-
3
-
4
-
5
-
6
-
7
-
8
-
9
-
10
-
11
-
12
-
13
-
14
-
15
-
16
-
17
-
18
-
19
-
20
-
21
-
22
-
23
-
24
-
25
-
26
-
27
-
28
-
29
-
30
-
31
-
32
-
33
-
34
-
35
-
36
-
37
-
38
-
39
-
40
-
41
-
42
-
43
-
44
-
45
-
46
-
47
-
48
-
49
-
50
-
51
-
52
-
53
-
54
-
55
-
56
-
57
-
58
-
59
-
60
-
61
-
62
-
63
-
64
-
65
-
66
-
67
-
68
-
69
-
70
-
71
-
72
-
73
-
74
-
75
-
76
-
77
-
78
-
79
-
80
-
81
-
82
-
83
-
84
-
85
-
86
-
87
-
88
-
89
-
90
-
91
-
92
-
93
-
94
-
95
-
96
-
97
-
 98
98 -
 99
99 -
 100
100 -
 101
101 -
 102
102 -
 103
103 -
 104
104 -
 105
105 -
 106
106 -
 107
107 -
 108
108 -
 109
109 -
 110
110 -
 111
111 -
 112
112
 |
 |

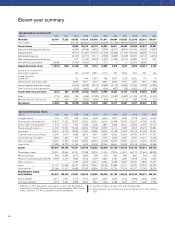
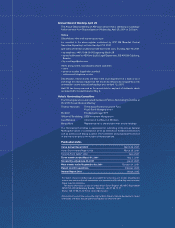
ELEVEN-YEAR SUMMARY
106
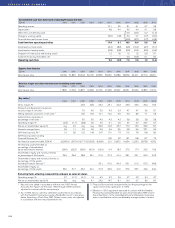
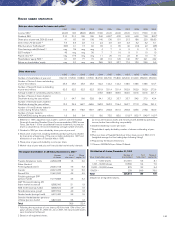
Environmental performance of Volvo production plants
Absolute values related to net sales 1997 1998 1999 2000
Energy consumption (GWh;MWh/SEK M) 3,019; 16.6 3,045; 14.7 1,815; 14.5 1,656; 12.7
Water consumption (´000 m3;m3/SEK M) 11,692; 64.1 10,172; 49.0 6,730; 53.8 6,138; 47.2
NOx emissions (tons;kilos/SEK M) 644; 3.5 611; 2.9 478; 3.8 464; 3.6
Solvent emissions (tons;kilos/SEK M) 2,618; 14.4 1,823; 8.8 1,333; 10.7 1,422; 10.9
Sulphur dioxide emissions (tons) 98 63 77 90
Hazardous waste (tons) 17,877 18,593 15,596 17,170
Net sales, SEK M 182,293 3207,539 2125,019 130,070
1 Values are based on performance at plants excluding Cars. Comparison with prior years not possible due to differences in production structure,
see Volvo’s Environmental Report 2000.
2 Excluding MASA, VCE Korea, Nova BUS och Carrus Group, which were acquired during the year.
3 Excluding Champion Road Machinery.
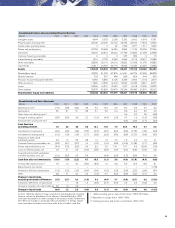
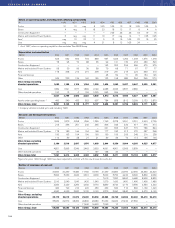
Volvo vehicles invoiced
Number 1990 1991 1992 1993 1994 1995 1996 1997 1998 1999 2000
Heavy trucks 50,680 47,580 43,030 47,280 63,560 71,360 59,100 63,930 78,690 81,240 76,470
Medium-heavy trucks 5,040 6,180 5,100 3,950 4,940 5,130 4,580 5,050 4,590 3,850 5,360
Total trucks 55,720 53,760 48,130 51,230 68,500 76,490 63,680 68,980 83,280 85,090 81,830
Buses and bus chassis 4,830 4,650 5,580 5,450 5,770 6,830 7,410 8,730 10,200 9,500 11,015
Cars 356,150 297,950 307,310 302,110 351,000 374,640 368,250 386,440 399,680 ——
1990 1991 1992 1993 1994 1995 1996 1997 1998 1999 2000
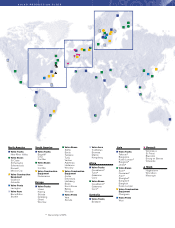
Trucks Total Europe 28,700 27,000 22,200 17,100 27,000 34,160 34,970 34,470 42,350 42,530 46,140
Western Europe 27,980 25,800 21,250 16,240 25,450 32,330 32,310 31,040 37,810 39,630 42,050
Eastern Europe 720 1,200 950 860 1,550 1,830 2,660 3,430 4,540 2,900 4,090
North America 16,460 13,380 16,720 21,860 26,460 27,090 16,850 20,900 29,310 34,300 23,610
South America 3,980 3,480 3,590 5,900 8,320 7,800 4,980 6,970 6,020 3,900 4,530
Asia 4,610 8,100 4,120 4,840 4,830 5,270 4,850 4,710 3,760 2,720 5,560
Other markets 1,970 1,800 1,500 1,530 1,890 2,170 2,030 1,930 1,840 1,640 1,990
Total 55,720 53,760 48,130 51,230 68,500 76,490 63,680 68,980 83,280 85,090 81,830
Buses Total Europe 2,970 2,430 2,360 2,610 3,040 3,570 3,840 4,190 3,860 3,630 3,994
Western Europe 2,940 2,410 2,320 2,520 2,900 3,510 3,770 4,030 3,580 3,430 3,870
Eastern Europe 30 20 40 90 140 60 70 160 280 200 124
North America 30 — 10 30 10 340 750 1,110 2,730 3,640 3,869
South America 1,070 1,340 1,780 1,320 1,630 1,510 1,460 1,350 1,510 710 980
Asia 270 640 1,270 1,050 780 920 1,060 1,410 1,650 1,000 1,659
Other markets 490 240 160 440 310 490 300 670 450 520 513
Total 4,830 4,650 5,580 5,450 5,770 6,830 7,410 8,730 10,200 9,500 11,015
Effective in 1997, The Volvo Group’s accounting per market area reflects geographical definitions based on an ISO standard. The accounting for the years
1991–1996 has been adjusted to conform with the new principle.
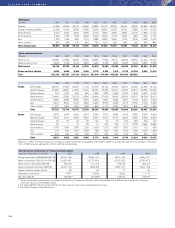
Employees
Number 1990 1991 1992 1993 1994 1995 1996 1997 1998 1999 2000
Sweden 47,260 42,960 39,130 43,980 44,880 47,000 43,330 43,650 43,900 24,840 25,030
Europe, excluding Sweden 12,180 11,630 12,040 16,280 18,040 16,930 15,290 16,100 17,880 11,900 12,320
North America 5,720 5,320 5,540 6,950 6,100 7,860 6,900 8,450 12,100 11,880 11,410
South America 1,940 1,730 1,520 3,400 3,400 3,620 2,130 2,000 1,980 1,930 2,100
Asia 1,270 1,460 1,380 2,170 2,380 2,830 2,260 1,720 3,340 2,480 2,570
Other markets 430 480 510 860 750 810 420 980 620 440 840
Volvo Group total 68,800 63,580 60,120 73,640 75,550 79,050 70,330 72,900 79,820 53,470 54,270