Volvo 2000 Annual Report Download - page 105
Download and view the complete annual report
Please find page 105 of the 2000 Volvo annual report below. You can navigate through the pages in the report by either clicking on the pages listed below, or by using the keyword search tool below to find specific information within the annual report.-
 1
1 -
2
-
3
-
4
-
5
-
6
-
7
-
8
-
9
-
10
-
11
-
12
-
13
-
14
-
15
-
16
-
17
-
18
-
19
-
20
-
21
-
22
-
23
-
24
-
25
-
26
-
27
-
28
-
29
-
30
-
31
-
32
-
33
-
34
-
35
-
36
-
37
-
38
-
39
-
40
-
41
-
42
-
43
-
44
-
45
-
46
-
47
-
48
-
49
-
50
-
51
-
52
-
53
-
54
-
55
-
56
-
57
-
58
-
59
-
60
-
61
-
62
-
63
-
64
-
65
-
66
-
67
-
68
-
69
-
70
-
71
-
72
-
73
-
74
-
75
-
76
-
77
-
78
-
79
-
80
-
81
-
82
-
83
-
84
-
85
-
86
-
87
-
88
-
89
-
90
-
91
-
92
-
93
-
94
-
 95
95 -
 96
96 -
 97
97 -
 98
98 -
 99
99 -
 100
100 -
 101
101 -
 102
102 -
 103
103 -
 104
104 -
 105
105 -
 106
106 -
 107
107 -
 108
108 -
 109
109 -
 110
110 -
 111
111 -
 112
112
 |
 |
103
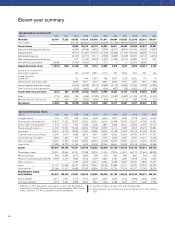
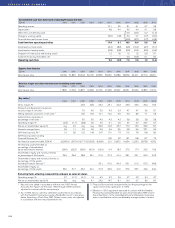
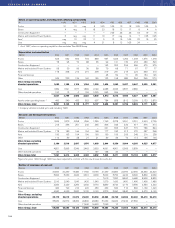
1 Included in the Volvo Group as of mid-year 1995. Operating income for
Volvo Construction Equipment in the years 1991 to 1995, calculated using the average rate for the US dollar for each year, amounted to
(193), (436), 502, 1,621 och 1,679.
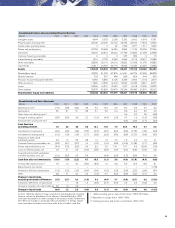
Operating income
SEK M 1990 1991 1992 1993 1994 1995 1996 1997 1998 1999 2000
Trucks 1,114 941 (619) 585 4,051 5,020 783 1,707 2,815 3,247 1,414
Buses 53 (166) 71 313 318 405 331 550 385 224 440
Construction Equipment 1— — — — — 717 1,162 1,436 1,536 1,709 1,594
Marine and Industrial Power Systems 20 (113) (76) 125 223 212 (27) 181 95 314 484
Aero 8 202 305 143 60 103 153 472 527 584 621
Financial Services 341 294 173 266 166 281 311 479 590 977 1,396
Other and eliminations (35) (103) 102 62 (62) (193) (429) (678) (567) (329) 205
Volvo Group excluding
divested operations 1,501 1,055 (44) 1,494 4,756 6,545 2,284 4,147 5,381 6,726 6,154
Cars (957) (1,597) (1,691) 626 2,771 1,089 1,498 4,510 3,808 — –
Other divested operations 364 — — — 1,885 1,531 91 – — — –
Operating income excluding
items affecting comparability 908 (542) (1,735) 2,120 9,412 9,165 3,873 8,657 9,189 6,726 6,154
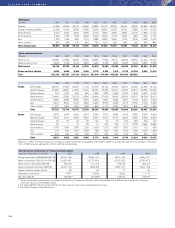
Items affecting comparability
Trucks (350) — (270) — — — — — (46) – –
Buses (300) — — — — — — — (422) – –
Construction Equipment 1— — — — — — — — (910) – –
Marine and Industrial Power Systems (50) — (108) — — — — — (158) – –
Aero — — (44) — — — — — — – –
Other and eliminations (50) — (221) (1,600) — (1,817) — — (114) – –
Volvo Group excluding
divested operations (750) — (643) (1,600) — (1,817) — — (1,650) — –
Cars (1,700) — (807) — — — — — (681) 26,695 –
Other divested operations — — — — — 3,032 — — — –
Volvo Group total (2,450) — (1,450) (1,600) — 1,215 — — (2,331) 26,695 –
Operating income excluding
divested operations 751 1,055 (687) (106) 4,756 4,728 2,284 4,147 3,731 6,726 6,154
Operating income, Volvo Group (1,542) (542) (3,185) 520 9,412 10,380 3,873 8,657 6,858 33,421 6,154
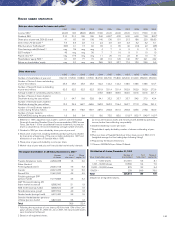
Operating margin
% 1990 1991 1992 1993 1994 1995 1996 1997 1998 1999 2000
Trucks 4.1 3.4 (2.4) 1.7 8.8 10.6 1.9 3.6 4.8 5.2 2.3
Buses 1.3 (4.3) 1.6 5.7 5.2 5.3 3.9 5.2 2.7 1.5 2.6
Construction Equipment 1— — — — — 10.4 9.1 8.6 7.9 9.1 8.0
Marine and Industrial Power Systems 0.7 (4.4) (3.0) 4.2 6.0 5.5 (0.7) 4.1 1.9 5.5 7.3
Aero 0,3 5,5 8,9 3,9 1,7 2.7 3.7 6.3 6.1 5.9 5.8
Financial Services — — — — — 5.7 5.5 9.4 8.2 11.3 14.4
Volvo Group excluding
divested operations 2.5 1.7 (0.1) 2.7 6.8 8.5 3.0 4.5 4.7 5.4 4.7
Cars (2.4) (4.3) (3.8) 1.1 3.8 1.3 1.8 4.7 3.7 — –
Operating margin, excluding
items affecting comparability 0.7 (1.1) (2.1) 1.9 6.0 5.3 2.5 4.7 4.3 5.4 4.7
Operating margin, total (2.3) (1.1) (3.8) 0.5 6.0 6.1 2.5 4.7 3.2 26.7 4.7
1 Included in the Volvo Group as of mid-year 1995. Operating margin for Volvo Construction Equipment for the years 1991
to 1995 amounted to (2.3), (5.5), 5.2, 13.4 and 12.3.