Volvo 2000 Annual Report Download - page 100
Download and view the complete annual report
Please find page 100 of the 2000 Volvo annual report below. You can navigate through the pages in the report by either clicking on the pages listed below, or by using the keyword search tool below to find specific information within the annual report.-
 1
1 -
2
-
3
-
4
-
5
-
6
-
7
-
8
-
9
-
10
-
11
-
12
-
13
-
14
-
15
-
16
-
17
-
18
-
19
-
20
-
21
-
22
-
23
-
24
-
25
-
26
-
27
-
28
-
29
-
30
-
31
-
32
-
33
-
34
-
35
-
36
-
37
-
38
-
39
-
40
-
41
-
42
-
43
-
44
-
45
-
46
-
47
-
48
-
49
-
50
-
51
-
52
-
53
-
54
-
55
-
56
-
57
-
58
-
59
-
60
-
61
-
62
-
63
-
64
-
65
-
66
-
67
-
68
-
69
-
70
-
71
-
72
-
73
-
74
-
75
-
76
-
77
-
78
-
79
-
80
-
81
-
82
-
83
-
84
-
85
-
86
-
87
-
88
-
89
-
 90
90 -
 91
91 -
 92
92 -
 93
93 -
 94
94 -
 95
95 -
 96
96 -
 97
97 -
 98
98 -
 99
99 -
 100
100 -
 101
101 -
 102
102 -
 103
103 -
 104
104 -
 105
105 -
 106
106 -
 107
107 -
 108
108 -
 109
109 -
 110
110 -
111
-
112
 |
 |
98
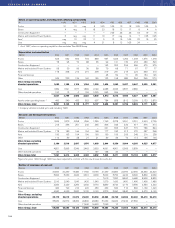
Consolidated balance sheets
SEK M 1990 1991 1992 1993 1994 1995 1996 1997 1998 1999 2000
Intangible assets 318 373 298 2.284 4,545 5,626 2,277 3,284 5,778 6,618 6,925
Property, plant and equipment 18,327 17,232 18,377 25,922 25,991 25,094 26,458 30,793 36,207 19,788 22,231
Assets under operating leases 21,570 1,317 1,753 2,235 2,205 2,847 4,968 13,501 22,285 12,337 14,216
Shares and participations 21,530 30,399 30,494 26,299 18,548 18,087 12,412 4,583 3,393 29,213 30,481
Inventories 18,316 16,705 18,368 21,390 23,380 23,929 23,148 27,993 32,128 21,438 23,551
Customer financing receivables 2,545 2,672 9,083 8,019 9,351 10,336 15,552 32,304 46,798 34,313 41,791
Interest bearing receivables 3,839 1,842 405 602 1,516 2,766 4,080 4,667 4,735 18,617 19,228
Other receivables 118,067 17,429 16,469 26,323 28,597 26,708 25,603 27,087 34,197 24,019 26,352
Liquid funds 17,585 18,779 21,760 2,442 24,449 23,306 26,661 20,603 20,224 29,269 15,968
Assets 102,097 106,748 117,007 134,516 138,582 138,699 141,159 164,815 205,745 195,612 200,743
Shareholders’ equity 135,291 33,864 29,721 27,088 43,332 51,200 57,876 61,951 69,375 97,692 88,338
Minority interests 300 4,986 3,919 6,686 838 605 504 899 860 544 593
Provision for postemployment benefits 3,769 4,245 5,085 6,139 6,097 6,890 3,150 3,296 2,936 2,130 2,632
Other provisions 3– – 11,653 14,235 13,914 14,602 14,988 19,657 25,187 14,832 14,941
Loans 31,151 31,980 42,641 42,675 33,551 28,166 31,886 41,217 64,230 53,345 66,233
Other liabilities 331,586 31,673 23,988 37,693 40,850 37,236 32,755 37,795 43,157 27,069 28,006
Shareholders’ equity
and liabilities 102,097 106,748 117,007 134,516 138,582 138,699 141,159 164,815 205,745 195,612 200,743
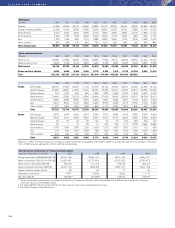
Assets pledged 2,417 2,641 4,114 4,613 6,527 5,434 6,503 6,743 5,388 3,930 2,990
Contingent liabilities 3,270 4,691 6,808 8,656 7,581 7,450 6,188 5,406 6,737 6,666 6,789
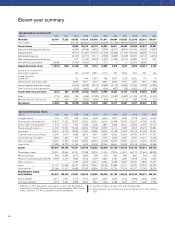
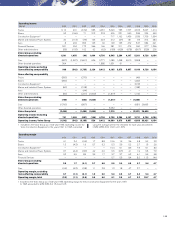
Consolidated income statements
SEK M 1990 1991 1992 1993 1994 1995 1996 1997 1998 1999 2000
Net sales 83,185 77,223 83,002 111,155 155,866 171,511 156,060 183,625 212,936 125,019 130,070
Cost of sales (66,143) (85,840) (115,092) (128,529) (121,249) (138,990)(163,876) (99,501) (104,548)
Gross income 16,859 25,315 40,774 42,982 34,811 44,635 49,060 25,518 25,522
Research and development expenses (6,243) (4,438) (4,652) (7,343) (8,271) (8,659) (10,104) (4,525) (4,876)
Selling expenses (8,717) (11,480) (15,737) (17,418) (14,895) (17,160) (19,042) (8,865) (10,140)
Administrative expenses (4,151) (6,131) (7,711) (7,399) (6,685) (7,018) (8,091) (4,791) (4,974)
Other operating income and expenses 517 (1,146) (3,262) (1,657) (1,087) (3,141) (2,634) (611) 622
Items affecting comparability (2,450) – (1,450) (1,600) 0 1,215 0 0 (2,331) 26,695 0
Operating income (loss) (1,542) (542) (3,185) 520 9,412 10,380 3,873 8,657 6,858 33,421 6,154
Income from investments in
associated companies 120 (1,749) 5,861 2,119 314 2,929 444 567 444
Income from other
investments 157 444 1,667 788 9,007 1,168 4,526 170 70
Interest income and similar credits 3,694 4,041 2,927 3,801 4,530 3,197 1,268 1,812 1,588
Interest expenses and similar charges (4,906) (5,458) (3,572) (3,686) (3,114) (2,699) (1,315) (1,505) (1,845)
Other financial income and expenses (629) (440) 83 (354) (407) (76) (162) 131 (165)
Income after financial items (327) 803 (4,749) (2,642) 16,378 13,048 14,203 13,176 11,619 34,596 6,246
Taxes 1(719) (560) 138 (468) (2,783) (3,741) (1,825) (2,583) (3,140) (2,270) (1,510)
Minority interests in net income 26 439 1,291 (356) (365) (45) 99 (112) (42) (104) (27)
Net income (1,020) 682 (3,320) (3,466) 13,230 9,262 12,477 10,481 8,437 32,222 4,709
1 Effective in 1997, adjustment was made to conform with the Swedish
Financial Accounting Standard Council's recommendation, RR9, Income
Taxes. See Note 1 to the consolidated financial statements.
2 Including company vehicles up to and including 1991.
3 Other provisions are included among other liabilities up to and including
1991.
Eleven-year summary