Volvo 2000 Annual Report Download - page 102
Download and view the complete annual report
Please find page 102 of the 2000 Volvo annual report below. You can navigate through the pages in the report by either clicking on the pages listed below, or by using the keyword search tool below to find specific information within the annual report.-
 1
1 -
2
-
3
-
4
-
5
-
6
-
7
-
8
-
9
-
10
-
11
-
12
-
13
-
14
-
15
-
16
-
17
-
18
-
19
-
20
-
21
-
22
-
23
-
24
-
25
-
26
-
27
-
28
-
29
-
30
-
31
-
32
-
33
-
34
-
35
-
36
-
37
-
38
-
39
-
40
-
41
-
42
-
43
-
44
-
45
-
46
-
47
-
48
-
49
-
50
-
51
-
52
-
53
-
54
-
55
-
56
-
57
-
58
-
59
-
60
-
61
-
62
-
63
-
64
-
65
-
66
-
67
-
68
-
69
-
70
-
71
-
72
-
73
-
74
-
75
-
76
-
77
-
78
-
79
-
80
-
81
-
82
-
83
-
84
-
85
-
86
-
87
-
88
-
89
-
90
-
91
-
 92
92 -
 93
93 -
 94
94 -
 95
95 -
 96
96 -
 97
97 -
 98
98 -
 99
99 -
 100
100 -
 101
101 -
 102
102 -
 103
103 -
 104
104 -
 105
105 -
 106
106 -
 107
107 -
 108
108 -
 109
109 -
 110
110 -
 111
111 -
 112
112
 |
 |
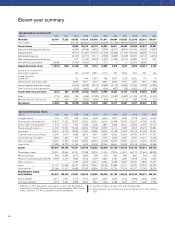
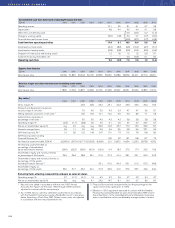
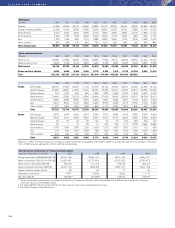
Key ratios 4
1990 1991 1992 1993 1994 1995 1996 1997 1998 1999 2000
Gross margin, % 120.3 22.8 26.2 25.1 22.3 24.3 23.0 20.4 19.6
Research and development expenses
as percentage of net sales 17.5 4.0 3.0 4.3 5.3 4.7 4.7 3.6 3.7
Selling expenses as percent of net sales 110.5 10.3 10.1 10.2 9.5 9.3 8.9 7.1 7.8
Administration expenses as
percentage of net sales 15.0 5.5 4.9 4.3 4.3 3.8 3.8 3.8 3.8
Operating margin, % (2.3) (1.1) (3.8) 0.5 6.0 6.1 2.5 4.7 3.2 26.7 4.7
Return on shareholders’ equity, % neg 2.0 neg neg 36.5 19.3 23.7 17.2 13.0 34.9 5.0
Interest coverage, times 0.9 1.1 0.2 0.6 5.5 4.6 5.5 5.8 9.6 23.1 4.5
Self-financing ratio, % 219 82 122 148 247 151 73 115 78 108 89
Self-financing ratio excluding
Financial Services, % 2190 87 181 108 127 72
Net financial assets/net debt, SEK M (9,256) (11,357) (18,117) (20,592) (6,999) 201 10,672 16,956 12,232 28,758 9,392
Net financial assets/net debt as
percentage of shareholders’
equity and minority interests (26.0) (29.2) (53.9) (61.0) (15.9) 0.4 18.3 27.0 17.4 29.3 10.6
Shareholders’ equity and minority interests
as percentage of total assets 34.9 36.4 28.8 25.1 31.9 37.4 41.4 38.1 34.1 50.2 44.3
Shareholders’ equity and minority interests as
percentage of total assets,
excluding Financial Services 335.1 41.9 49.4 53.1 51.2 67.3 60.8
Shareholders’ equity as
percentage of total assets 34.6 31.7 25.4 20.1 31.3 36.9 41.0 37.6 33.7 49.9 44.0
Excluding items affecting comparability and gain on sales of shares
Operating margin, % 0.7 (1.1) (2.1) 1.9 6.0 5.3 2.5 4.7 4.3 5.4 4.7
Return on shareholders’ equity, % 3.6 neg neg 4.1 24.2 14.7 8.1 10.4 9.7 8.0 5.0
1 Key ratios are stated in accordance with the new 1997 Annual
Accounts Act. Figures for the years 1992 through 1996 have been
adjusted to conform with the new principle.
2 As of 1999, Volvo’s cash flow statement is presented in accordance
with the Swedish Financial Accounting Standards Council’s recommen-
dation, Reporting of Cash Flow, RR7. Values in prior years are adjusted
in accordance with the new presentation form.
3 Financial Services had a marginal effect on the percentage of risk
capital and minority capital prior to 1994.
4 Effective in 1997, adjustment was made to conform with the Swedish
Financial Accounting Standard Council’s recommendation, RR9, Income
Taxes. See Note 1, to the consolidated financial statements. Income per
share is calculated as net income divided by average number of shares.
ELEVEN-YEAR SUMMARY
100
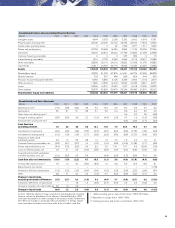
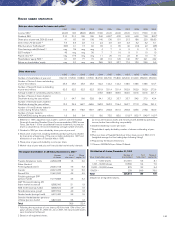
Consolidated cash flow statements excluding Financial Services
SEK bn 1990 1991 1992 1993 1994 1995 1996 1997 1998 1999 2000
Operating income 10.1 3.5 8.1 6.1 5.7 4.8
Depreciation 4.8 4.4 5.0 6.4 3.1 3.8
Other items not affecting cash 0.3 (0.5) 0.2 (1.2)
Change in working capital (3.5) (1.8) 3.4 0.7 (1.7) (3.0)
Financial items and income taxes (0.5) (2.3) (1.7) (0.8)
Cash flow from operating activities 11.4 6.1 16.3 10.4 5.6 3.6
Investments in fixed assets (6.4) (8.0) (9.5) (10.2) (4.7) (5.1)
Investments in leasing assets (0.8) (0.8) (0.5) (0.9) (0.5) (0.6)
Disposals of fixed assets and leasing assets 1.2 1.8 1.0 1.5 0.8 0.7
Customer-financing receivables, net – – 0.3 (0.3) 0.1 0.0
Operating cash flow 5.4 (0.9) 7.6 0.5 1.3 (1.4)
Salaries, wages and other remuneration (including social costs)
SEK M 1990 1991 1992 1993 1994 1995 1996 1997 1998 1999 2000
Volvo Group, total 17,865 17,654 16,857 19,489 24,156 27,248 25,997 26,951 30,064 19,832 21,510
Exports from Sweden
SEK M 1990 1991 1992 1993 1994 1995 1996 1997 1998 1999 2000
Volvo Group, total 32,182 31,881 30,344 36,130 43,330 56,059 54,589 58,569 64,401 52,719 46,251