Volvo 2000 Annual Report Download - page 69
Download and view the complete annual report
Please find page 69 of the 2000 Volvo annual report below. You can navigate through the pages in the report by either clicking on the pages listed below, or by using the keyword search tool below to find specific information within the annual report.-
 1
1 -
2
-
3
-
4
-
5
-
6
-
7
-
8
-
9
-
10
-
11
-
12
-
13
-
14
-
15
-
16
-
17
-
18
-
19
-
20
-
21
-
22
-
23
-
24
-
25
-
26
-
27
-
28
-
29
-
30
-
31
-
32
-
33
-
34
-
35
-
36
-
37
-
38
-
39
-
40
-
41
-
42
-
43
-
44
-
45
-
46
-
47
-
48
-
49
-
50
-
51
-
52
-
53
-
54
-
55
-
56
-
57
-
58
-
 59
59 -
 60
60 -
 61
61 -
 62
62 -
 63
63 -
 64
64 -
 65
65 -
 66
66 -
 67
67 -
 68
68 -
 69
69 -
 70
70 -
 71
71 -
 72
72 -
 73
73 -
 74
74 -
 75
75 -
 76
76 -
 77
77 -
 78
78 -
 79
79 -
80
-
81
-
82
-
83
-
84
-
85
-
86
-
87
-
88
-
89
-
90
-
91
-
92
-
93
-
94
-
95
-
96
-
97
-
98
-
99
-
100
-
101
-
102
-
103
-
104
-
105
-
106
-
107
-
108
-
109
-
110
-
111
-
112
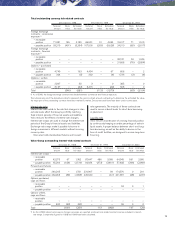
 |
 |
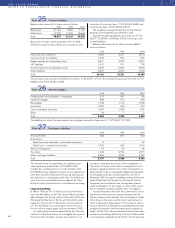
1998 1999 2000
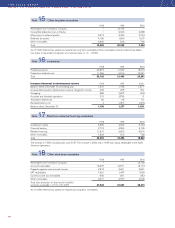
Warranties 6,599 3,594 3,644
Provisions in insurance operations 2,139 2,491 2,488
Provisions attributable to participations in associated companies 1,819 155 43
Restructuring measures 1,718 1,621 798
Provison for residual value risks 954 519 725
Provision for service contracts 629 913 1,247
Other provisions 7,012 3,321 3,731
Total 20,870 12,614 12,676
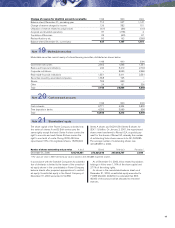
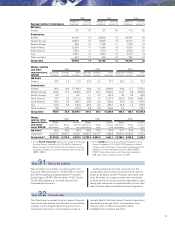
The listing below shows the Group’s non-current liabil-
ities in which the largest loans are distributed by curren-
cy. Most are issued by Volvo Treasury AB and Volvo
Group Finance Europe BV. Information on loan terms
is as of December 31, 2000. Volvo hedges foreign-
exchange and interest-rate risks using derivative instru-
ments. See also Note 32.
Bond loans 1998 1999 2000
FRF 1995–1998/2005–2009, 6.13–7.63% 3,887 3,271 3,383
GBP 1999/2003, 6.27% – – 142
DKK 1996–1998/2002–2005, 4.30–6.00% 704 377 389
SEK 1997–2000/2002–2008, 4.08–12.51% 3,749 3,101 2,952
JPY 1995–1999/2002–2005, 0.10–3.33% 2,640 4,654 4,812
HKD 1999/2006, 7.99% – – 122
ITL 1,357 221 –
NLG 1998/2003, 5.163% 214 248 256
DEM 771 – –
USD 1997–2000/2002–2008, 6.93–7.36% 1,921 1,918 667
EUR 1999–2000/2002–2009, 0.10–6.24% – 10,002 17,505
Other bond loans 381 446 644
Total bond loans 15,624 24,238 30,872
Other loans 1998 1999 2000
USD 1997–2000/2002–2017, 5.50–9.35% 3,721 2,954 4,487
GBP 1994–2000/2002–2009, 5.42–8.12% 777 1,151 858
DEM 1996–2000/2002–2006, 4.64% 46 489 493
BRL 1996–2000/2002–2006, 6.00–18.14% 258 364 849
NLG 1998–2000/2002–2004, 5.25–6.60% 214 266 254
SEK 1989–1999/2006–2013, 4.00–9.00% 657 631 822
CAD 1988/2003, 9.35% 490 543 558
PEI 1999–2000/2002–2004, 5.43–8.01% – – 418
Other loans 3,567 1,586 794
Total other long-term loans 9,730 7,984 9,533
Other long-term liabilities 658 292 265
Total 26,012 32,514 40,670
Of the above long-term loans, 2,360 (2,527; 2,823) was secured.
67
the financial statements when the present value could
be calculated in a reliable manner. The rules governing
how the refund was to be made were established in the
spring of 2000 and a refund of 683 was recognized in
Volvo's accounts during the second quarter of 2000. The
present value of the refund was included as Other oper-
ating income in the income statement. In the balance
sheet, the unsettled refunds are shown as interest-bear-
ing receivables.
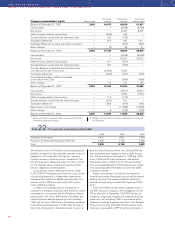
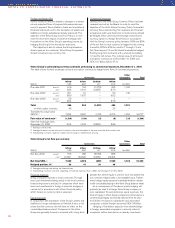
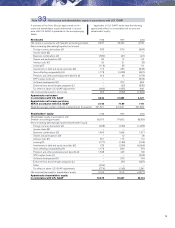
Long-term liabilities mature as follows:
2002 6,532
2003 5,408
2004 10,844
2005 5,650
2006 1,843
2007 or later 10,393
Total 40,670
At year-end 2000, credit facilities granted but not utilized
and which can be used without restrictions amounted to
approximately SEK 23 billion (20; 22). In 2000 approxi-
mately SEK 19 billion of these facilities consisted of
stand-by facilities for loans with varying maturities
through the year 2003. A fee normally not exceeding
0.25% of the unused portion is charged for credit facilities.
Note 23 Other provisions
Note 24 Non-current liabilities