Volvo 2000 Annual Report Download - page 25
Download and view the complete annual report
Please find page 25 of the 2000 Volvo annual report below. You can navigate through the pages in the report by either clicking on the pages listed below, or by using the keyword search tool below to find specific information within the annual report.-
 1
1 -
2
-
3
-
4
-
5
-
6
-
7
-
8
-
9
-
10
-
11
-
12
-
13
-
14
-
 15
15 -
 16
16 -
 17
17 -
 18
18 -
 19
19 -
 20
20 -
 21
21 -
 22
22 -
 23
23 -
 24
24 -
 25
25 -
 26
26 -
 27
27 -
 28
28 -
 29
29 -
 30
30 -
 31
31 -
 32
32 -
 33
33 -
 34
34 -
 35
35 -
36
-
37
-
38
-
39
-
40
-
41
-
42
-
43
-
44
-
45
-
46
-
47
-
48
-
49
-
50
-
51
-
52
-
53
-
54
-
55
-
56
-
57
-
58
-
59
-
60
-
61
-
62
-
63
-
64
-
65
-
66
-
67
-
68
-
69
-
70
-
71
-
72
-
73
-
74
-
75
-
76
-
77
-
78
-
79
-
80
-
81
-
82
-
83
-
84
-
85
-
86
-
87
-
88
-
89
-
90
-
91
-
92
-
93
-
94
-
95
-
96
-
97
-
98
-
99
-
100
-
101
-
102
-
103
-
104
-
105
-
106
-
107
-
108
-
109
-
110
-
111
-
112
 |
 |

23
THE VOLVO GROUP YEAR 2000
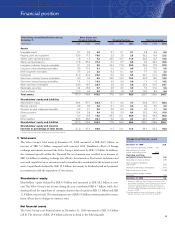
Financial position
Total assets
The Volvo Group’s total assets at December 31, 2000 amounted to SEK 200.7 billion, an
increase of SEK 5.1 billion compared with year-end 1999. Translation effects of foreign
exchange movements increased the Volvo Group’s total assets by SEK 7.2 billion. In addition,
the continued growth within the Financial Services business area resulted in an increase of
SEK 6.6 billion (excluding exchange rate effects). Investments in fixed assets and shares and
increased capital tied up in inventories and receivables also contributed to the increase in total
assets. Liquid funds declined by SEK 13.3 billion, due mainly to dividends paid and payments
in conjunction with the repurchase of own shares.
Shareholders’ equity
Shareholders’ equity declined by SEK 9.4 billion and amounted to SEK 88.3 billion at year-
end. The Volvo Group’s net income during the year contributed SEK 4.7 billion, while divi-
dends paid and the repurchase of company shares reduced equity by SEK 3.1 billion and SEK
11.8 billion, respectively. The remaining increase of SEK 0.8 billion pertains primarily to trans-
lation effects due to changes in currency rates.
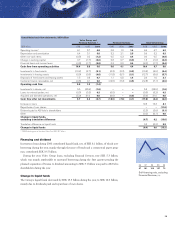
Net financial assets
The Volvo Group’s net financial assets at December 31, 2000 amounted to SEK 9.4 billion
(28.8). The decrease of SEK 19.4 billion is shown in detail in the following table.
▲
Change in net financial assets
SEK billion
December 31, 1999128.8
Cash flow from operating activities 3.6
Net investments in fixed
assets and leasing assets (5.0)
Operating cash flow,
excluding Financial Services (1.4)
Acquisition of shares in Scania (1.3)
Other acquired subsidiaries
and shares 2(0.3)
Dividend to AB Volvo’s shareholders (3.1)
Repurchase of own shares (11.8)
Other, including foreign currency
translation (1.5)
December 31, 2000 9.4
1 Effective in 2000, the Volvo Group’s net financial assets
are calculated excluding Financial Services, since interest
income and interest expenses in these operations are
included in operating income. The change resulted in a
decrease of SEK 2.2 billion in net financial assets as of
January 1, 2000.
2 Including purchase amount and financial net debt in
acquired companies. See further Note 2, page 56.
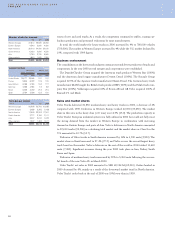
Volvo Group consolidated balance sheets, Volvo Group, excl
December 31 Financial Services 1Financial Services Total Volvo Group
SEK billion 1998 1999 2000 1998 1999 2000 1998 1999 2000
Assets
Intangible assets 5.7 6.5 6.8 0.1 0.1 0.1 5.8 6.6 6.9
Property, plant and equipment 33.9 17.3 19.6 2.3 2.5 2.6 36.2 19.8 22.2
Assets under operating leases 1.8 1.6 4.2 20.5 10.7 11.9 22.3 12.3 14.2
Shares and participations 11.8 35.3 37.4 0.7 0.7 0.8 3.4 29.2 30.5
Long-term customer finance receivables 0.1 0.0 0.0 24.4 17.8 23.0 24.5 17.8 22.9
Long-term interest-bearing receivables 3.3 17.6 5.1 0.0 0.0 0.0 3.3 17.6 5.0
Other long-term receivables 7.5 2.4 2.2 0.2 0.1 0.1 7.7 2.5 2.2
Inventories 31.9 21.0 23.0 0.2 0.4 0.6 32.1 21.4 23.6
Short-term customer finance receivables 0.3 0.0 0.0 22.0 16.5 19.2 22.3 16.5 18.9
Short-term interest bearing receivables 1.4 1.0 14.2 0.0 0.0 0.0 1.4 1.0 14.2
Other short-term receivables 23.9 18.7 22.7 2.6 2.9 2.6 26.5 21.6 24.1
Marketable securities 4.4 18.0 5.7 2.8 3.0 3.9 7.2 21.0 9.6
Cash and bank 11.0 6.5 5.3 2.0 1.8 1.7 13.0 8.3 6.4
Total assets 137.0 145.9 146.2 77.8 56.5 66.5 205.7 195.6 200.7
Shareholders’ equity and liabilities
Shareholders’ equity 69.4 97.7 88.3 9.1 6.8 7.7 69.4 97.7 88.3
Minority interests 0.8 0.5 0.6 0.1 0.0 0.0 0.9 0.5 0.6
Provision for post employment benefits 2.9 2.1 2.6 0.0 0.0 0.0 2.9 2.1 2.6
Other provisions 19.4 9.8 8.4 5.8 5.0 6.6 25.2 14.8 15.0
Loans 5.0 12.3 18.2 59.2 41.1 49.0 64.2 53.4 66.2
Other liabilities 39.5 23.5 28.1 3.6 3.6 3.2 43.1 27.1 28.0
Shareholders’ equity and liablities 137.0 145.9 146.2 77.8 56.5 66.5 205.7 195.6 200.7
Shareholders’ equity and minority
interests as percentage of total assets 51.2 67.3 60.8 11.7 12.1 11.5 34.1 50.2 44.3
1 Financial Services reported in accordance with the equity method.