Volvo 2000 Annual Report Download - page 62
Download and view the complete annual report
Please find page 62 of the 2000 Volvo annual report below. You can navigate through the pages in the report by either clicking on the pages listed below, or by using the keyword search tool below to find specific information within the annual report.-
 1
1 -
2
-
3
-
4
-
5
-
6
-
7
-
8
-
9
-
10
-
11
-
12
-
13
-
14
-
15
-
16
-
17
-
18
-
19
-
20
-
21
-
22
-
23
-
24
-
25
-
26
-
27
-
28
-
29
-
30
-
31
-
32
-
33
-
34
-
35
-
36
-
37
-
38
-
39
-
40
-
41
-
42
-
43
-
44
-
45
-
46
-
47
-
48
-
49
-
50
-
51
-
 52
52 -
 53
53 -
 54
54 -
 55
55 -
 56
56 -
 57
57 -
 58
58 -
 59
59 -
 60
60 -
 61
61 -
 62
62 -
 63
63 -
 64
64 -
 65
65 -
 66
66 -
 67
67 -
 68
68 -
 69
69 -
 70
70 -
 71
71 -
 72
72 -
73
-
74
-
75
-
76
-
77
-
78
-
79
-
80
-
81
-
82
-
83
-
84
-
85
-
86
-
87
-
88
-
89
-
90
-
91
-
92
-
93
-
94
-
95
-
96
-
97
-
98
-
99
-
100
-
101
-
102
-
103
-
104
-
105
-
106
-
107
-
108
-
109
-
110
-
111
-
112
 |
 |

THE VOLVO GROUP
NOTES TO CONSOLIDATED FINANCIAL STATEMENTS
60
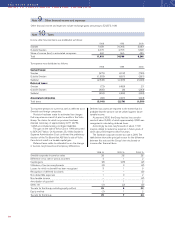
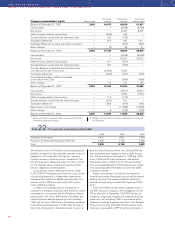
Income after financial items was distributed as follows:
1998 1999 2000
Sweden 7,089 31,268 3,983
Outside Sweden 4,070 2,763 1,828
Share of income (loss) in associated companies 460 565 435
Total 11,619 34,596 6,246
Tax expense was distributed as follows:
1998 1999 2000
Current taxes:
Sweden (975) (812) (755)
Outside Sweden (1,553) (651) (291)
Subtotal (2,528) (1,463) (1,046)
Deferred taxes:
Sweden (72) (480) 23
Outside Sweden (480) (6) (243)
Subtotal (552) (486) (220)
Associated companies (60) (321) (244)
Total taxes (3,140) (2,270) (1,510)
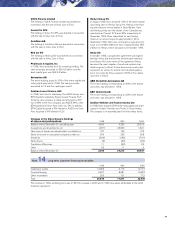
Tax expense pertains to current as well as deferred tax in
Swedish and foreign companies.
Provision has been made for estimated tax charges
that may arise as a result of prior tax audits in the Volvo
Group. Tax claims for which no provision has been
deemed necessary of approximately 2,071 (2,754;
1,442) are included among contingent liabilities.
The gain on the sale of Volvo Cars in 1999 amounted
to SEK 26.7 billion. On November 25, 1999, Sweden’s
Supreme Administrative Court confirmed the preliminary
decision of the Tax Board that AB Volvo’s sale of Volvo
Cars did not result in a taxable capital gain.
Deferred taxes relate to estimated tax on the change
in tax loss carryforwards and temporary differences.
1998, % 1999, % 2000, %
Swedish corporate income tax rates 28 28 28
Difference in tax rate in various countries 4 1 2
Capital gains (8) (23) (2)
Utilization of tax-loss carryforwards (2) 0 (2)
Losses for which no benefit has been recognized 3 1 0
Recognition of deferred tax assets – – (3)
Non-deductible expenses 1 0 2
Non-taxable income – – (2)
Amortization of goodwill 1 1 2
Other, net (1) (2) (3)
Tax rate for the Group, excluding equity method 26 6 22
Equity method (1) 1 2
Tax rate for the Group 25 7 24
Deferred tax assets are reported to the extent that it is
probable that the amount can be utilized against future
taxable income.
At year-end 2000, the Group had tax loss carryfor-
wards of about 5,200, of which approximately 3,500 was
recognized in calculating deferred taxes.
Accordingly, tax loss carryforwards of about 1,700
may be utilized to reduce tax expense in future years, of
which about 500 expires within five years.
The Swedish corporate income tax rate is 28%. The
table below shows the principal reason for the difference
between this rate and the Group’s tax rate, based on
income after financial items.
Other financial income and expenses include exchange gains amounting to 52 (372; 164).
Note 9 Other financial income and expenses
Note 10 Taxes