Volvo 2000 Annual Report Download - page 45
Download and view the complete annual report
Please find page 45 of the 2000 Volvo annual report below. You can navigate through the pages in the report by either clicking on the pages listed below, or by using the keyword search tool below to find specific information within the annual report.-
 1
1 -
2
-
3
-
4
-
5
-
6
-
7
-
8
-
9
-
10
-
11
-
12
-
13
-
14
-
15
-
16
-
17
-
18
-
19
-
20
-
21
-
22
-
23
-
24
-
25
-
26
-
27
-
28
-
29
-
30
-
31
-
32
-
33
-
34
-
 35
35 -
 36
36 -
 37
37 -
 38
38 -
 39
39 -
 40
40 -
 41
41 -
 42
42 -
 43
43 -
 44
44 -
 45
45 -
 46
46 -
 47
47 -
 48
48 -
 49
49 -
 50
50 -
 51
51 -
 52
52 -
 53
53 -
 54
54 -
 55
55 -
56
-
57
-
58
-
59
-
60
-
61
-
62
-
63
-
64
-
65
-
66
-
67
-
68
-
69
-
70
-
71
-
72
-
73
-
74
-
75
-
76
-
77
-
78
-
79
-
80
-
81
-
82
-
83
-
84
-
85
-
86
-
87
-
88
-
89
-
90
-
91
-
92
-
93
-
94
-
95
-
96
-
97
-
98
-
99
-
100
-
101
-
102
-
103
-
104
-
105
-
106
-
107
-
108
-
109
-
110
-
111
-
112
 |
 |

43
95%, of which 56% to external customers. Of total leasing, 40% involved contracts longer than
five years.
Volvo Treasury’s value added, included in operating income as of 2000, is generated through
management of the Volvo Group’s assets and liabilities, and foreign exchange
operations.
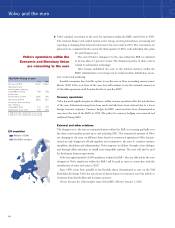
During the year, Volvo Treasury continued to develop the Group’s treasury
operations, in part through the introduction of a common cash-pool system for Europe.
Operating income
Operating income amounted to SEK 1,396 M (977), of which SEK 610 M pertained to gains
on the sale of Volvia’s securities portfolio, and SEK 38 M to SPP refunds. Operating income
1999 included reversals of reserves for customer financing of SEK 240 M. Adjusted for the sale
of securities, including the lower yield from Volvia’s portfolio compared with the preceding
year, the refund from SPP, Volvo Treasury’s income and the reversal of reserves in 1999, oper-
ating income declined by 8%, compared with year-earlier income.
Operating income in the established customer-financing companies was stable, but was
affected by increased credit losses from truck financing in North America. At the same time, in-
come from operations in South America and Eastern Europe was higher than in previous years.
Income from other operations – insurance, real estate and treasury – was higher than in the
preceding year.
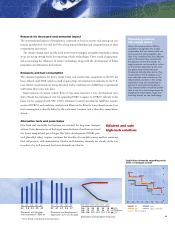
Provision for risks
Provision is made for both credit risks and residual-value risks to the degree that residual-value
risks are attributable to the customer-financing company. For customers unable to fulfill their
contractual obligations, specific provisions for credit risks are made based on an individual
assessment of each contract. In addition, in accordance with established policies, provisions are
made for estimated credit and residual-value losses for each customer-financing company,
based on historical data and anticipated future risks.
Total reserves amounted to 2.7% of the credit portfolio at year-end (2.7), of which the
reserve for residual-value risk amounted to 0.4%, and the credit reserve allocated to individ-
ual contracts amounted to 1.6%. Realized credit losses in 2000 amounted to SEK 411 M, com-
pared with SEK 277 M in 1999. The negative effect on income for the year of changes in
reserves and realized credit losses amounted to SEK 397 M.
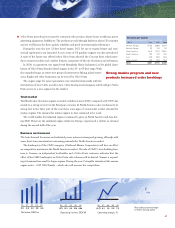
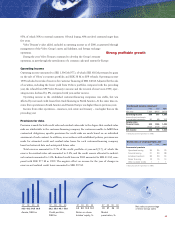
Strong profitable growth
00
Assets, SEK bn
999897
66.556.543.233.3
97 98 99 00
Return on share-
holders’ equity, %
4.0 8.9 12.0 14.1
97 98 99 00
Market
penetration, %
30 27 26 31
00
Credit portfolio,
SEK bn
999897
53.645.135.426.2
Distribution of credit portfolio, net1
% 1998 1999 2000
Commercial products
Operational leasing 26 25 23
Financial leasing 31 29 28
Installment contracts 26 29 34
Dealer financing 16 16 14
Other customer credits 1 1 1
1) Excluding divested operations in 1998
Condensed income statement1
SEK M 1998 1999 2000
Net sales 7,224 8,637 9,678
Operating income 590 977 1,396
Income from investments
in associated companies 90 89 103
Income after
financial items 680 1,066 1,499
Taxes (242) (316) (471)
Net income 438 750 1,028
1) Excluding divested operations in 1998
Net sales as percentage
of Volvo Group sales
7%