Volvo 2000 Annual Report Download - page 103
Download and view the complete annual report
Please find page 103 of the 2000 Volvo annual report below. You can navigate through the pages in the report by either clicking on the pages listed below, or by using the keyword search tool below to find specific information within the annual report.-
 1
1 -
2
-
3
-
4
-
5
-
6
-
7
-
8
-
9
-
10
-
11
-
12
-
13
-
14
-
15
-
16
-
17
-
18
-
19
-
20
-
21
-
22
-
23
-
24
-
25
-
26
-
27
-
28
-
29
-
30
-
31
-
32
-
33
-
34
-
35
-
36
-
37
-
38
-
39
-
40
-
41
-
42
-
43
-
44
-
45
-
46
-
47
-
48
-
49
-
50
-
51
-
52
-
53
-
54
-
55
-
56
-
57
-
58
-
59
-
60
-
61
-
62
-
63
-
64
-
65
-
66
-
67
-
68
-
69
-
70
-
71
-
72
-
73
-
74
-
75
-
76
-
77
-
78
-
79
-
80
-
81
-
82
-
83
-
84
-
85
-
86
-
87
-
88
-
89
-
90
-
91
-
92
-
 93
93 -
 94
94 -
 95
95 -
 96
96 -
 97
97 -
 98
98 -
 99
99 -
 100
100 -
 101
101 -
 102
102 -
 103
103 -
 104
104 -
 105
105 -
 106
106 -
 107
107 -
 108
108 -
 109
109 -
 110
110 -
 111
111 -
 112
112
 |
 |
101
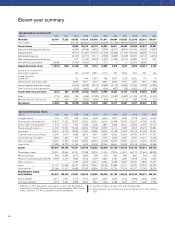
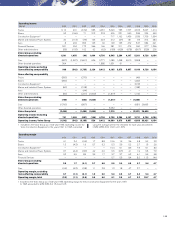
Data per share (adjusted for issues and splits) 1
1990 1991 1992 1993 1994 1995 1996 1997 1998 1999 2000
Income, SEK 1(2.60) 1.80 (8.60) (8.90) 31.80 20.20 26.90 23.20 19.10 73.00 11:20
Dividend, SEK 3.10 3.10 1.55 1.55 3.40 4.00 84.30 5.00 6.00 7.00 8.00 9
Share price at year-end, SEK (B share) 41 63 69 108 140 136 151 213 186 220 156,50
Direct return, % (B share) 27.6 4.9 2.3 1.4 2.4 2.9 2.9 2.3 3.2 3.2 5.1
Effective return, % (B share) 3(50)61136032 03046(10)22(23)
Price/earnings ratio (B share) 4neg36negneg47699314
EBIT multiple 545 neg neg 36 7 7 16 9 11 10 10
Payout ratio, % 6neg 176 neg neg 11 20 16 22 31 10 71
Shareholders’ equity, SEK 791 87 77 70 98 110 125 140 157 221 222
Return on shareholders’ equity neg 2.0 neg neg 36.5 19.3 23.7 17.2 13.0 34.9 5.0
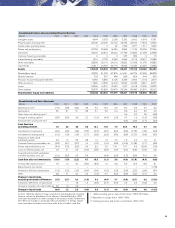
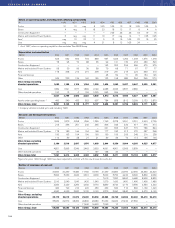
Other share data
1990 1991 1992 1993 1994 1995 1996 1997 1998 1999 2000
Number of shareholders at year-end 169,100 170,500 163,800 147,300 182,700 206,700 176,800 225,500 210,600 238,000 230,000
Number of Series A shares outstanding
at year-end, millions 25.3 25.3 25.3 25.3 142.2 142.2 142.2 138.6 138.6 138.6 124.7
Number of Series B shares outstanding
at year-end, millions 52.3 52.3 52.3 52.3 301.9 321.4 321.4 302.9 302.9 302.9 272.6
Average number of outstanding shares, millions 415.9 458.9 463.6 452.5 441.5 441.5 421.7
Number of Series A shares traded in
Stockholm during the year, millions 2.1 64.7 16.6 32.8 54.1 23.2 23.7 23.7 34.5 27.0 42.4
Number of Series B shares traded in
Stockholm during the year, millions 13.2 34.5 169.7 465.5 363.3 363.3 316.4 362.7 371.3 479.6 391.2
Number of A and B shares traded in
London during the year, millions 11.0 89.1 178.9 150.7 287.5 232.8 301.0 260.8 425.5 215.8 143.0
Number of shares traded in
ADR, NASDAQ during the year, millions 1.9 9.9 9.4 11.5 19.0 73.5 83.0 51.8 10 50.5 10 54.9 10 16.010
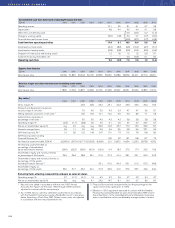
1 Effective in 1997, adjustment was made to conform with the Swedish
Financial Accounting Standard Council’s recommendation, RR9, Income
Taxes. See Note 1 to the consolidated financial statements. Income per
share is calculated as net income divided by average number of shares.
2 Dividend in SEK per share divided by share price at year-end.
3 Share price at year-end, including dividend paid during the year, divided
by share price at beginning of the year, including redemption 1997 and
distribution of one share of Swedish Match 1996.
4 Share price at year-end divided by income per share.
5 Market value at year-end plus net financial debt and minority interests
(or minus net financial assets and minority share), divided by operating
income, before items affecting comparability.
6 Dividend divided by income per share.
7 Shareholders’ equity divided by number of shares outstanding at year-
end.
8 Plus one share of Swedish Match per Volvo share, price of SEK 21.74
(weighted average first ten trading days following listing).
9 Proposed by the Board of Directors.
10 Source: NASDAQ/Amex Online/Citibank.
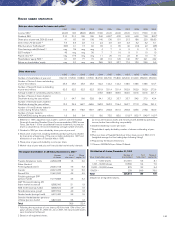
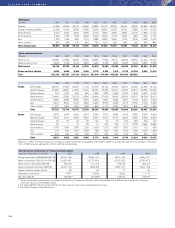
VOLVO SHARE STATISTICS
Distribution of shares, December 31, 2000
Number of % of Share of
Volvo shareholder owning shareholders total votes 2capital, % 2
1–1,000 shares 212,031 6.5 8.1
1,001–10,000 shares 13,365 5.4 7.5
10,001–100,000 shares 879 3.2 5.4
100,001– 239 84.9 79.0
Total 226,514 100 100
2 Based on all registered shares.
The largest shareholders in AB Volvo, December 31, 2000 1
Number % of Share
of shares total votes2capital, % 2
Franklin-Templetons funds 24,596,938 1.5 5.6
Robur (funds of
FöreningsSparbanken) 23,281,158 7.6 5.3
Investor 22,021,235 1.9 5.0
Renault S.A. 21,601,500 4.9 4.9
Försäkringsbolaget SPP
(pension funds) 16,179,883 4.3 3.2
AMF Pensionsförsäkring AB
(labor market insurance) 8,585,000 3.1 1.9
SEB fonder (savings funds) 8,380,524 2.9 1.9
Skandia (insurance group) 8,657,554 4.0 1.8
Nordea fonder (savings funds) 6,421,400 2.9 1.5
Svenska Handelsbanken pensions-
stiftelse (pension funds) 5,897,000 3.5 1.3
Total 36.6 32.4
1 Following the repurchase of own shares, AB Volvo held 10% of the Com-
pany’s shares on Dec 31, 2000. On Jan 2, 2001, the repurchased shares
were transferred to Renault.
2 Based on all registered shares.