Volvo 2000 Annual Report Download - page 61
Download and view the complete annual report
Please find page 61 of the 2000 Volvo annual report below. You can navigate through the pages in the report by either clicking on the pages listed below, or by using the keyword search tool below to find specific information within the annual report.-
 1
1 -
2
-
3
-
4
-
5
-
6
-
7
-
8
-
9
-
10
-
11
-
12
-
13
-
14
-
15
-
16
-
17
-
18
-
19
-
20
-
21
-
22
-
23
-
24
-
25
-
26
-
27
-
28
-
29
-
30
-
31
-
32
-
33
-
34
-
35
-
36
-
37
-
38
-
39
-
40
-
41
-
42
-
43
-
44
-
45
-
46
-
47
-
48
-
49
-
50
-
 51
51 -
 52
52 -
 53
53 -
 54
54 -
 55
55 -
 56
56 -
 57
57 -
 58
58 -
 59
59 -
 60
60 -
 61
61 -
 62
62 -
 63
63 -
 64
64 -
 65
65 -
 66
66 -
 67
67 -
 68
68 -
 69
69 -
 70
70 -
 71
71 -
72
-
73
-
74
-
75
-
76
-
77
-
78
-
79
-
80
-
81
-
82
-
83
-
84
-
85
-
86
-
87
-
88
-
89
-
90
-
91
-
92
-
93
-
94
-
95
-
96
-
97
-
98
-
99
-
100
-
101
-
102
-
103
-
104
-
105
-
106
-
107
-
108
-
109
-
110
-
111
-
112
 |
 |

59
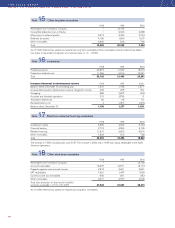
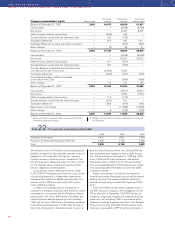
Volvo’s share of income in associated companies before taxes, is shown below:
Income (loss) Dividends received
1998 1999 2000 1998 1999 2000
Bilia AB 131 89 120 35 35 41
AB Volvofinans 87 89 111 7 8 8
Aviation Lease Finance 3 7 19 – – –
Xian Silver Bus Corp 16 4 13 – – –
AVC Intressenter AB 6 1 (1) 506 81 24
Omninova Technology AB 0 (26) (17) – – –
Turbec (4) (22) (44) – – –
Arrow Truck Sales – (21) (76) – – –
Petro Stopping Centers Holding LP – (13) (46) – – –
Other companies (25) (10) 15 1 9 31
Holdings no longer reported as
equity method investments
Scania AB 1– 467 341 – – 637
Netherlands Car BV 232 –––––
VOCS Finance Ltd 16 – – 85 – –
Other companies (2) –––––
Subtotal 460 565 435 634 133 741
Gains (loss) on sale of shares
in associated companies
Other companies (16) 2 9
Subtotal (16) 2 9
Total income from investments
in associated companies 444 567 444
1 On March 14, 2000 the European Commission rejected Volvo's application for approval of Volvo’s proposed acquisition of Scania.
As a result, Volvo's holding in Scania is no longer reported in accordance with the equity method.
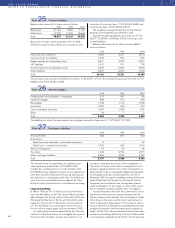
1998 1999 2000
Dividends received
Scania AB 1– 180 –
Henlys Group Plc – 13 23
Pharmacia & Upjohn, Inc. 43 – –
Other 3 8 3
Subtotal 46 201 26
Gain on sales of securities
Pharmacia & Upjohn, Inc. 4,452 — –
Stockholms Fondbörs AB 33 — –
Holdings of Volvo Technology Transfer 2– – 105
Other (5) 3(31) 3(61) 3
Subtotal 4,480 (31) 44
Total 4,526 170 70
1 Pertains to dividends received during the period when Volvo’s holding was less than 20%.
2 A Volvo venture-capital company.
3 Including write-down of shares.
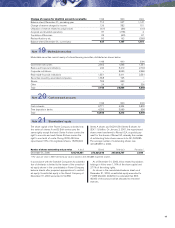
Note 8Income from other investments
Note 7Income from investments in associated companies