Volvo 2000 Annual Report Download - page 84
Download and view the complete annual report
Please find page 84 of the 2000 Volvo annual report below. You can navigate through the pages in the report by either clicking on the pages listed below, or by using the keyword search tool below to find specific information within the annual report.-
 1
1 -
2
-
3
-
4
-
5
-
6
-
7
-
8
-
9
-
10
-
11
-
12
-
13
-
14
-
15
-
16
-
17
-
18
-
19
-
20
-
21
-
22
-
23
-
24
-
25
-
26
-
27
-
28
-
29
-
30
-
31
-
32
-
33
-
34
-
35
-
36
-
37
-
38
-
39
-
40
-
41
-
42
-
43
-
44
-
45
-
46
-
47
-
48
-
49
-
50
-
51
-
52
-
53
-
54
-
55
-
56
-
57
-
58
-
59
-
60
-
61
-
62
-
63
-
64
-
65
-
66
-
67
-
68
-
69
-
70
-
71
-
72
-
73
-
 74
74 -
 75
75 -
 76
76 -
 77
77 -
 78
78 -
 79
79 -
 80
80 -
 81
81 -
 82
82 -
 83
83 -
 84
84 -
 85
85 -
 86
86 -
 87
87 -
 88
88 -
 89
89 -
 90
90 -
 91
91 -
 92
92 -
 93
93 -
 94
94 -
95
-
96
-
97
-
98
-
99
-
100
-
101
-
102
-
103
-
104
-
105
-
106
-
107
-
108
-
109
-
110
-
111
-
112
 |
 |

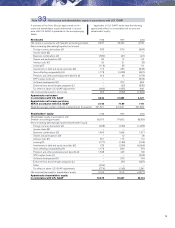
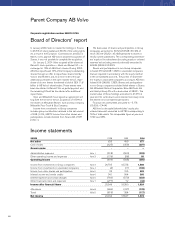
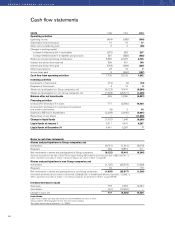
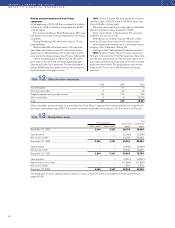
PARENT COMPANY AB VOLVO
82
SEK M 1998 1999 2000
Operating activities
Operating income (494) (588) (300)
Depreciation and amortization 19 19 17
Other items not affecting cash 0 0 (49)
Changes in working capital:
Increase (–)/decrease (+) in receivables (270) 893 207
Increase (+)/decrease (–) in liabilities and provisions 287 (888) (636)
Dividends received and Group contributions 8,565 24,270 2,735
Interest and similar items received 339 491 148
Interest and similar items paid (768) (684) (330)
Other financial items 23 72 7
Income taxes paid 8 (460) (147)
Cash flow from operating activities 7,709 23,125 1,652
Investing activities
Investments in fixed assets (72) (2) (10)
Disposals of fixed assets 4 12 0
Shares and participations in Group companies, net (6,122) 15,441 (6,264)
Shares and participations in non-Group companies, net (1,093) (25,517) (1,209)
Balance after net investments 426 13,059 (5,831)
Financing activities
Increase (+)/ decrease (–) in loans 717 (8,566) 14,434
Increase (+)/ decrease (–) in provisions for pensions
and similar commitments (5) 2 16
Dividend to AB Volvo’s shareholders (2,208) (2,649) (3,091)
Repurchase of own shares – – (11,808)
Change in liquid funds (1,070) 1,846 (6,280)
Liquid funds at January 1 5,511 4,441 6,287
Liquid funds at December 31 4,441 6,287 7
Notes to cash flow statements
Shares and participations in Group companies, net
Investments (6,761) (1,431) (6,675)
Disposals 639 16,872 411
Net investments in shares and participations in Group companies (6,122) 15,441 (6,264)
Proceeds received from the sale of Volvo Personvagnar Holding AB resulted in a positive cash flow of 382 (16,136; –).
Other investments and sales of shares in Group companies are shown in Note 11, page 85
Shares and participations in non-Group companies, net
Investments (1,125) (25,518) (1,328)
Disposals 32 1 119
Net investments in shares and participations in non-Group companies (1,093) (25,517) (1,209)
Investments pertained mainly to shares in Scania AB, 1,328 (23,023; –), and Mitsubishi Motors Corporation, – (2,343; –).
Other investments and sales of shares in non-Group companies are presented in Note 11, pages 85-86.
Increase/decrease in loans
New loans 778 2,363 14,434
Amortization (61) (10,929) –
Change in loans, net 717 (8,566) 14,434
Liquid funds
Liquid funds include cash and bank balances and marketable securities in Volvo
Treasury before offsetting against loans from the same company.
The offset amount was at year-end – (–; 2,565).
Cash flow statements