Volvo 2000 Annual Report Download - page 54
Download and view the complete annual report
Please find page 54 of the 2000 Volvo annual report below. You can navigate through the pages in the report by either clicking on the pages listed below, or by using the keyword search tool below to find specific information within the annual report.-
 1
1 -
2
-
3
-
4
-
5
-
6
-
7
-
8
-
9
-
10
-
11
-
12
-
13
-
14
-
15
-
16
-
17
-
18
-
19
-
20
-
21
-
22
-
23
-
24
-
25
-
26
-
27
-
28
-
29
-
30
-
31
-
32
-
33
-
34
-
35
-
36
-
37
-
38
-
39
-
40
-
41
-
42
-
43
-
 44
44 -
 45
45 -
 46
46 -
 47
47 -
 48
48 -
 49
49 -
 50
50 -
 51
51 -
 52
52 -
 53
53 -
 54
54 -
 55
55 -
 56
56 -
 57
57 -
 58
58 -
 59
59 -
 60
60 -
 61
61 -
 62
62 -
 63
63 -
 64
64 -
65
-
66
-
67
-
68
-
69
-
70
-
71
-
72
-
73
-
74
-
75
-
76
-
77
-
78
-
79
-
80
-
81
-
82
-
83
-
84
-
85
-
86
-
87
-
88
-
89
-
90
-
91
-
92
-
93
-
94
-
95
-
96
-
97
-
98
-
99
-
100
-
101
-
102
-
103
-
104
-
105
-
106
-
107
-
108
-
109
-
110
-
111
-
112
 |
 |

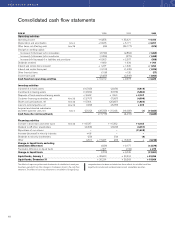
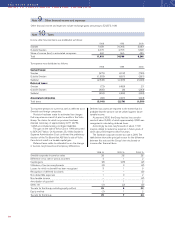
52
SEK M 1998 1999 2000
Operating activities
Operating income + 6,858 + 33,421 + 6,154
Depreciation and amortization Note 6 + 9,626 + 5,171 + 6,251
Other items not affecting cash Note 28 (26) (26,117) (679)
Changes in working capital:
Increase (–)/decrease (+) in receivables (2,744) (2,864) (1,450)
Increase (–)/decrease (+) in inventories (1,306) (370) (1,458)
Increase (+)/decrease(–) in liabilities and provisions + 5,553 + 2,207 (356)
Dividends received + 680 + 334 + 767
Interest and similar items received + 1,227 + 1,520 + 1,262
Interest and similar items paid (1,213) (1,405) (1,325)
Other financial items (158) +125 (57)
Income taxes paid (2,485) (2,349) (1,084)
Cash flow from operating activities + 16,012 + 9,673 + 8,025
Investing activities
Investments in fixed assets (10,549) (4,924) (5,419)
Investments in leasing assets (12,654) (5,578) (5,684)
Disposals of fixed assets and leasing assets + 2,632 + 1,569 + 2,107
Customer-financing receivables, net Note 28 (12,767) (7,087) (4,509)
Shares and participations, net Note 28 + 5,504 (25,887) (1,654)
Loans to external parties, net Note 28 (329) (3,230) + 305
Acquired and divested subsidiaries
and other business units, net Note 2 (5,622) (33,785) + 31,048 (14,089) (1) (14,855)
Cash flow after net investments (17,773) (4,416) (6,830)
Financing activities
Increase in bond loans and other loans Note 28 + 19,537 + 16,332 + 8,162
Dividend to AB Volvo shareholders (2,208) (2,649) (3,091)
Repurchase of own shares – – (11,808)
Increase (decrease) in minority interests + 68 – –
Dividends to minority shareholders (59) (70) (9)
Other (251) + 17,087 (20) + 13,593 – (6,746)
Change in liquid funds, excluding
translation differences (686) + 9,177 (13,576)
Translation difference on liquid funds + 307 (132) + 275
Change in liquid funds (379) + 9,045 (13,301)
Liquid funds, January 1 + 20,603 + 20,224 + 29,269
Liquid funds, December 31 + 20,224 + 29,269 + 15,968
The effects of major acquisitions and divestments of subsidiaries in each year
have been excluded from other changes in the balance sheet in the cash flow
statement. The effects of currency movements in translation of foreign Group
companies have also been excluded since these effects do not affect cash flow.
Liquid funds include cash and bank balances and marketable securities.
THE VOLVO GROUP
Consolidated cash flow statements