Volvo 2000 Annual Report Download - page 27
Download and view the complete annual report
Please find page 27 of the 2000 Volvo annual report below. You can navigate through the pages in the report by either clicking on the pages listed below, or by using the keyword search tool below to find specific information within the annual report.-
 1
1 -
2
-
3
-
4
-
5
-
6
-
7
-
8
-
9
-
10
-
11
-
12
-
13
-
14
-
15
-
16
-
 17
17 -
 18
18 -
 19
19 -
 20
20 -
 21
21 -
 22
22 -
 23
23 -
 24
24 -
 25
25 -
 26
26 -
 27
27 -
 28
28 -
 29
29 -
 30
30 -
 31
31 -
 32
32 -
 33
33 -
 34
34 -
 35
35 -
 36
36 -
 37
37 -
38
-
39
-
40
-
41
-
42
-
43
-
44
-
45
-
46
-
47
-
48
-
49
-
50
-
51
-
52
-
53
-
54
-
55
-
56
-
57
-
58
-
59
-
60
-
61
-
62
-
63
-
64
-
65
-
66
-
67
-
68
-
69
-
70
-
71
-
72
-
73
-
74
-
75
-
76
-
77
-
78
-
79
-
80
-
81
-
82
-
83
-
84
-
85
-
86
-
87
-
88
-
89
-
90
-
91
-
92
-
93
-
94
-
95
-
96
-
97
-
98
-
99
-
100
-
101
-
102
-
103
-
104
-
105
-
106
-
107
-
108
-
109
-
110
-
111
-
112
 |
 |
25
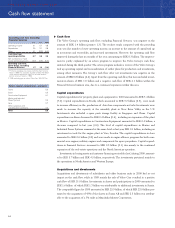
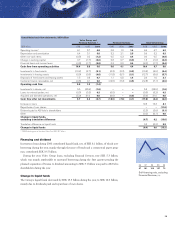
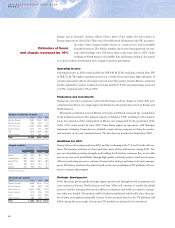
Financing and dividend
Increases in loans during 2000 contributed liquid funds, net, of SEK 8.1 billion, of which new
borrowing during the year, mainly through the issue of bonds and a commercial paper prog-
ram, contributed SEK 19.5 billion.
During the year, Volvo Group loans, excluding Financial Services, rose SEK 5.3 billion,
which was mainly attributable to increased borrowing during the first quarter pending the
planned acquisition of Scania. A dividend amounting to SEK 3.1 billion was paid to AB Volvo
shareholders during the year.
Change in liquid funds
The Group’s liquid funds decreased by SEK 13.3 billion during the year, to SEK 16.0 billion,
mainly due to dividends paid and repurchase of own shares.
Consolidated cash flow statements, SEK billion
Volvo Group, excl
Financial Services 1Financial Services Total Volvo Group
SEK billion 1998 1999 2000 1998 1999 2000 1998 1999 2000
Operating income 16.1 5.7 4.8 0.8 1.0 1.4 6.9 6.7 6.2
Depreciation and amortization 6.4 3.1 3.8 3.2 2.1 2.5 9.6 5.2 6.3
Other non-cash items (0.5) 0.2 (1.2) 0.5 0.3 0.4 0.0 0.5 (0.8)
Change in working capital 0.7 (1.7) (3.0) 0.8 0.7 (0.3) 1.5 (1.0) (3.3)
Financial items and income taxes (2.3) (1.7) (0.8) 0.3 0.0 0.4 (2.0) (1.7) (0.4)
Cash flow from operating activities 10.4 5.6 3.6 5.6 4.1 4.4 16.0 9.7 8.0
Investments in fixed assets (10.2) (4.7) (5.1) (0.3) (0.2) (0.3) (10.5) (4.9) (5.4)
Investments in leasing assets (0.9) (0.5) (0.6) (11.8) (5.1) (5.1) (12.7) (5.6) (5.7)
Disposals of fixed assets and leasing assets 1.5 0.8 0.7 1.1 0.8 1.4 2.6 1.6 2.1
Customer finance receivables, net (0.3) 0.1 0.0 (12.5) (7.2) (4.5) (12.8) (7.1) (4.5)
Operating cash flow 0.5 1.3 (1.4)
Investments in shares, net 5.5 (25.9) (1.6) ———5.5 (25.9) (1.6)
Loans to external parties, net (0.3) (3.2) 0.3 (0.0) — —(0.3) (3.2) 0.3
Acquired and divested operations, net (5.0) 31.0 0.0 (0.6) — (0.0) (5.6) 31.0 0.0
Cash flow after net investments 0.7 3.2 (2.7) (18.5) (7.6) (4.1) (17.8) (4.4) (6.8)
Increase in loans 19.5 16.3 8.1
Repurchase of own shares ––(11.8)
Dividends paid to AB Volvo’s shareholders (2.2) (2.6) (3.1)
Other (0.2) (0.1) 0.0
Change in liquid funds,
excluding translation difference (0.7) 9.2 (13.6)
Translation difference on liquid funds 0.3 (0.2) 0.3
Change in liquid funds (0.4) 9.0 (13.3)
1 1999: Excluding gain on the sale of Volvo Cars, SEK 26.7 billions
96 97 98 99 00
Self-financing ratio, excluding
Financial Services, (%)
87 181 108 127 72