TripAdvisor 2012 Annual Report Download - page 97
Download and view the complete annual report
Please find page 97 of the 2012 TripAdvisor annual report below. You can navigate through the pages in the report by either clicking on the pages listed below, or by using the keyword search tool below to find specific information within the annual report.-
 1
1 -
2
-
3
-
4
-
5
-
6
-
7
-
8
-
9
-
10
-
11
-
12
-
13
-
14
-
15
-
16
-
17
-
18
-
19
-
20
-
21
-
22
-
23
-
24
-
25
-
26
-
27
-
28
-
29
-
30
-
31
-
32
-
33
-
34
-
35
-
36
-
37
-
38
-
39
-
40
-
41
-
42
-
43
-
44
-
45
-
46
-
47
-
48
-
49
-
50
-
51
-
52
-
53
-
54
-
55
-
56
-
57
-
58
-
59
-
60
-
61
-
62
-
63
-
64
-
65
-
66
-
67
-
68
-
69
-
70
-
71
-
72
-
73
-
74
-
75
-
76
-
77
-
78
-
79
-
80
-
81
-
82
-
83
-
84
-
85
-
86
-
 87
87 -
 88
88 -
 89
89 -
 90
90 -
 91
91 -
 92
92 -
 93
93 -
 94
94 -
 95
95 -
 96
96 -
 97
97 -
 98
98 -
 99
99 -
 100
100 -
 101
101 -
 102
102 -
 103
103 -
 104
104 -
 105
105 -
 106
106 -
 107
107 -
108
-
109
-
110
-
111
-
112
-
113
-
114
-
115
-
116
-
117
-
118
-
119
-
120
-
121
-
122
-
123
-
124
-
125
-
126
-
127
-
128
-
129
-
130
-
131
-
132
-
133
-
134
-
135
-
136
-
137
-
138
-
139
-
140
-
141
-
142
-
143
-
144
-
145
-
146
-
147
-
148
-
149
-
150
-
151
-
152
-
153
-
154
-
155
-
156
-
157
-
158
-
159
-
160
-
161
-
162
-
163
-
164
-
165
-
166
-
167
-
168
-
169
-
170
-
171
-
172
-
173
-
174
-
175
-
176
-
177
-
178
-
179
-
180
-
181
-
182
-
183
-
184
-
185
-
186
-
187
-
188
-
189
-
190
-
191
-
192
-
193
-
194
-
195
-
196
-
197
-
198
-
199
-
200
 |
 |

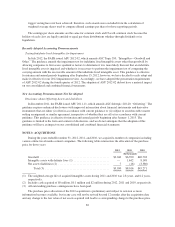
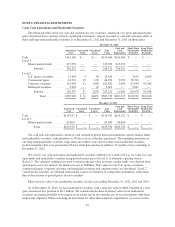
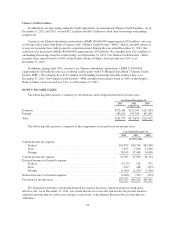
NOTE 5: FINANCIAL INSTRUMENTS
Cash, Cash Equivalents and Marketable Securities
The following tables show our cash and available-for-sale securities’ amortized cost, gross unrealized gains,
gross unrealized losses and fair value by significant investment category recorded as cash and cash equivalents or
short and long-term marketable securities as of December 31, 2012 and December 31, 2011 (in thousands):
December 31, 2012
Amortized
Cost
Unrealized
Gains
Unrealized
Losses
Fair
Value
Cash and
Cash
Equivalents
Short-Term
Marketable
Securities
Long-Term
Marketable
Securities
Cash ......................... $141,460 $— $ — $141,460 $141,460 $ — $ —
Level 1:
Money market funds ........ 215,052 — — 215,052 215,052 — —
Subtotal .............. 356,512 — — 356,512 356,512 — —
Level 2:
U.S. agency securities ....... 13,634 4 (3) 13,635 — 7,635 6,000
Commercial paper .......... 48,710 15 (22) 48,703 9,999 38,704 —
Corporate securities ........ 162,050 12 (180) 161,882 1,004 67,630 93,248
Municipal securities ........ 5,003 — (2) 5,001 — 5,001 —
Subtotal .............. 229,397 31 (207) 229,221 11,003 118,970 99,248
Total ............ $585,909 $ 31 $(207) $585,733 $367,515 $118,970 $99,248
December 31, 2011
Amortized
Cost
Unrealized
Gains
Unrealized
Losses
Fair
Value
Cash and
Cash
Equivalents
Short-Term
Marketable
Securities
Long-Term
Marketable
Securities
Cash ....................... $114,532 $ — $ — $114,532 $114,532 $ — $ —
Level 1:
Money market funds ....... 69,000 — — 69,000 69,000 — —
Total ............... $183,532 $ — $ — $183,532 $183,532 $ — $ —
Our cash and cash equivalents consist of cash on hand in global financial institutions, money market funds
and marketable securities, with maturities of 90 days or less at the date purchased. The remaining maturities of
our long-term marketable securities range from one to three years and our short-term marketable securities
include maturities that were greater than 90 days at the date purchased and have 12 months or less remaining at
December 31, 2012.
We classify our cash equivalents and marketable securities within Level 1 and Level 2 as we value our cash
equivalents and marketable securities using quoted market prices (Level 1) or alternative pricing sources
(Level 2). The valuation technique we used to measure the fair value of money market funds were derived from
quoted prices in active markets for identical assets or liabilities. Fair values for our U.S. agency securities,
commercial paper, corporate securities and municipal securities and corporate notes are considered “Level 2”
valuations because they are obtained from pricing sources for identical or comparable instruments, rather than
direct observations of quoted prices in active markets.
There were no sales of our marketable securities for the years ending December 31, 2012, 2011 and 2010.
As of December 31, 2012, we have marketable securities with a total fair value of $200.0 million in a total
gross unrealized loss position of $0.2 million. We consider the declines in market value of our marketable
securities investment portfolio to be temporary in nature and do not consider any of our investments other-than-
temporarily impaired. When evaluating an investment for other-than-temporary impairment, we review factors
87