TripAdvisor 2012 Annual Report Download - page 96
Download and view the complete annual report
Please find page 96 of the 2012 TripAdvisor annual report below. You can navigate through the pages in the report by either clicking on the pages listed below, or by using the keyword search tool below to find specific information within the annual report.-
 1
1 -
2
-
3
-
4
-
5
-
6
-
7
-
8
-
9
-
10
-
11
-
12
-
13
-
14
-
15
-
16
-
17
-
18
-
19
-
20
-
21
-
22
-
23
-
24
-
25
-
26
-
27
-
28
-
29
-
30
-
31
-
32
-
33
-
34
-
35
-
36
-
37
-
38
-
39
-
40
-
41
-
42
-
43
-
44
-
45
-
46
-
47
-
48
-
49
-
50
-
51
-
52
-
53
-
54
-
55
-
56
-
57
-
58
-
59
-
60
-
61
-
62
-
63
-
64
-
65
-
66
-
67
-
68
-
69
-
70
-
71
-
72
-
73
-
74
-
75
-
76
-
77
-
78
-
79
-
80
-
81
-
82
-
83
-
84
-
85
-
 86
86 -
 87
87 -
 88
88 -
 89
89 -
 90
90 -
 91
91 -
 92
92 -
 93
93 -
 94
94 -
 95
95 -
 96
96 -
 97
97 -
 98
98 -
 99
99 -
 100
100 -
 101
101 -
 102
102 -
 103
103 -
 104
104 -
 105
105 -
 106
106 -
107
-
108
-
109
-
110
-
111
-
112
-
113
-
114
-
115
-
116
-
117
-
118
-
119
-
120
-
121
-
122
-
123
-
124
-
125
-
126
-
127
-
128
-
129
-
130
-
131
-
132
-
133
-
134
-
135
-
136
-
137
-
138
-
139
-
140
-
141
-
142
-
143
-
144
-
145
-
146
-
147
-
148
-
149
-
150
-
151
-
152
-
153
-
154
-
155
-
156
-
157
-
158
-
159
-
160
-
161
-
162
-
163
-
164
-
165
-
166
-
167
-
168
-
169
-
170
-
171
-
172
-
173
-
174
-
175
-
176
-
177
-
178
-
179
-
180
-
181
-
182
-
183
-
184
-
185
-
186
-
187
-
188
-
189
-
190
-
191
-
192
-
193
-
194
-
195
-
196
-
197
-
198
-
199
-
200
 |
 |

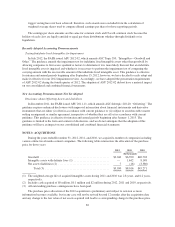
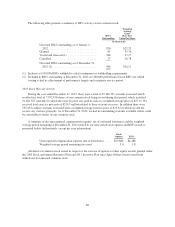
The following table presents a summary of RSU activity on our common stock:
RSUs
Outstanding
Weighted
Average
Grant-
Date Fair
Value Per Share
(In thousands)
Unvested RSUs outstanding as of January 1,
2012 .................................. 926 $21.32
Granted .................................. 85 35.76
Vested and released (1) ..................... 548 17.17
Cancelled ................................ 17 26.78
Unvested RSUs outstanding as of December 31,
2012 (2) ............................... 446 $26.11
(1) Inclusive of 190,856 RSUs withheld to satisfy minimum tax withholding requirements.
(2) Included in RSUs outstanding at December 31, 2012 are 200,000 performance based RSUs for which
vesting is tied to achievement of performance targets and a requisite service period.
2012 Stock Warrant Activity
During the year ended December 31, 2012, there were a total of 32,186,791 warrants exercised which
resulted in a total of 7,952,456 shares of our common stock being issued during that period, which included
31,641,337 warrants for which the exercise price was paid in cash at a weighted average price of $27.11. We
received total exercise proceeds of $214.5 million related to these warrant exercises. In addition there were
545,454 cashless warrants exercised with a weighted average exercise price of $25.92 of which we did not
receive any exercise proceeds. As of December 31, 2012, we had no outstanding warrants available which could
be convertible to shares of our common stock.
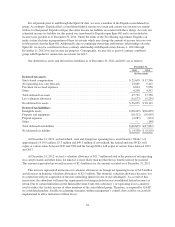
A summary of the unrecognized compensation expense, net of estimated forfeitures and the weighted
average period remaining at December 31, 2012 related to our non-vested stock options and RSU awards is
presented below (in thousands, except per year information):
Stock
Options RSUs
Unrecognized compensation expense (net of forfeitures) .... $59,686 $4,486
Weighted average period remaining (in years) ............ 3.0 1.8
All shares of common stock issued in respect of the exercise of options or other equity awards granted under
the 2005 Stock and Annual Incentive Plan and 2011 Incentive Plan since Spin-Off have been issued from
authorized, but unissued common stock.
86