TripAdvisor 2012 Annual Report Download - page 74
Download and view the complete annual report
Please find page 74 of the 2012 TripAdvisor annual report below. You can navigate through the pages in the report by either clicking on the pages listed below, or by using the keyword search tool below to find specific information within the annual report.-
 1
1 -
2
-
3
-
4
-
5
-
6
-
7
-
8
-
9
-
10
-
11
-
12
-
13
-
14
-
15
-
16
-
17
-
18
-
19
-
20
-
21
-
22
-
23
-
24
-
25
-
26
-
27
-
28
-
29
-
30
-
31
-
32
-
33
-
34
-
35
-
36
-
37
-
38
-
39
-
40
-
41
-
42
-
43
-
44
-
45
-
46
-
47
-
48
-
49
-
50
-
51
-
52
-
53
-
54
-
55
-
56
-
57
-
58
-
59
-
60
-
61
-
62
-
63
-
 64
64 -
 65
65 -
 66
66 -
 67
67 -
 68
68 -
 69
69 -
 70
70 -
 71
71 -
 72
72 -
 73
73 -
 74
74 -
 75
75 -
 76
76 -
 77
77 -
 78
78 -
 79
79 -
 80
80 -
 81
81 -
 82
82 -
 83
83 -
 84
84 -
85
-
86
-
87
-
88
-
89
-
90
-
91
-
92
-
93
-
94
-
95
-
96
-
97
-
98
-
99
-
100
-
101
-
102
-
103
-
104
-
105
-
106
-
107
-
108
-
109
-
110
-
111
-
112
-
113
-
114
-
115
-
116
-
117
-
118
-
119
-
120
-
121
-
122
-
123
-
124
-
125
-
126
-
127
-
128
-
129
-
130
-
131
-
132
-
133
-
134
-
135
-
136
-
137
-
138
-
139
-
140
-
141
-
142
-
143
-
144
-
145
-
146
-
147
-
148
-
149
-
150
-
151
-
152
-
153
-
154
-
155
-
156
-
157
-
158
-
159
-
160
-
161
-
162
-
163
-
164
-
165
-
166
-
167
-
168
-
169
-
170
-
171
-
172
-
173
-
174
-
175
-
176
-
177
-
178
-
179
-
180
-
181
-
182
-
183
-
184
-
185
-
186
-
187
-
188
-
189
-
190
-
191
-
192
-
193
-
194
-
195
-
196
-
197
-
198
-
199
-
200
 |
 |

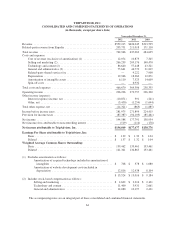
TRIPADVISOR, INC.
CONSOLIDATED AND COMBINED STATEMENTS OF OPERATIONS
(in thousands, except per share data)
Year ended December 31,
2012 2011 2010
Revenue ....................................................... $559,215 $426,045 $313,525
Related-party revenue from Expedia ................................. 203,751 211,018 171,110
Total revenue ................................................... 762,966 637,063 484,635
Costs and expenses:
Cost of revenue (exclusive of amortization) (1) .................... 12,074 10,873 7,345
Selling and marketing (2) ...................................... 266,239 209,176 140,470
Technology and content (2) .................................... 86,640 57,448 43,321
General and administrative (2) .................................. 75,641 44,770 31,819
Related-party shared services fee ................................ — 9,222 7,900
Depreciation ................................................ 19,966 18,362 12,871
Amortization of intangible assets ................................ 6,110 7,523 14,609
Spin-off costs ............................................... — 6,932 —
Total costs and expenses .......................................... 466,670 364,306 258,335
Operating income ................................................ 296,296 272,757 226,300
Other income (expense):
Interest (expense) income, net .................................. (10,871) 391 (241)
Other, net .................................................. (3,450) (1,254) (1,644)
Total other expense, net ........................................... (14,321) (863) (1,885)
Income before income taxes ........................................ 281,975 271,894 224,415
Provision for income taxes ......................................... (87,387) (94,103) (85,461)
Net income ..................................................... 194,588 177,791 138,954
Net (income) loss attributable to noncontrolling interest .................. (519) (114) (178)
Net income attributable to TripAdvisor, Inc. ........................ $194,069 $177,677 $138,776
Earnings Per Share attributable to TripAdvisor, Inc:
Basic ...................................................... $ 1.39 $ 1.33 $ 1.04
Diluted .................................................... $ 1.37 $ 1.32 $ 1.04
Weighted Average Common Shares Outstanding:
Basic ...................................................... 139,462 133,461 133,461
Diluted .................................................... 141,341 134,865 133,461
(1) Excludes amortization as follows:
Amortization of acquired technology included in amortization of
intangibles ........................................... $ 708 $ 578 $ 1,080
Amortization of website development costs included in
depreciation .......................................... 12,816 12,438 8,104
$ 13,524 $ 13,016 $ 9,184
(2) Includes stock-based compensation as follows:
Selling and marketing ..................................... $ 4,622 $ 3,216 $ 2,101
Technology and content ................................... 11,400 3,931 2,661
General and administrative ................................ 14,080 10,197 2,421
The accompanying notes are an integral part of these consolidated and combined financial statements.
64