TripAdvisor 2012 Annual Report Download - page 56
Download and view the complete annual report
Please find page 56 of the 2012 TripAdvisor annual report below. You can navigate through the pages in the report by either clicking on the pages listed below, or by using the keyword search tool below to find specific information within the annual report.-
 1
1 -
2
-
3
-
4
-
5
-
6
-
7
-
8
-
9
-
10
-
11
-
12
-
13
-
14
-
15
-
16
-
17
-
18
-
19
-
20
-
21
-
22
-
23
-
24
-
25
-
26
-
27
-
28
-
29
-
30
-
31
-
32
-
33
-
34
-
35
-
36
-
37
-
38
-
39
-
40
-
41
-
42
-
43
-
44
-
45
-
 46
46 -
 47
47 -
 48
48 -
 49
49 -
 50
50 -
 51
51 -
 52
52 -
 53
53 -
 54
54 -
 55
55 -
 56
56 -
 57
57 -
 58
58 -
 59
59 -
 60
60 -
 61
61 -
 62
62 -
 63
63 -
 64
64 -
 65
65 -
 66
66 -
67
-
68
-
69
-
70
-
71
-
72
-
73
-
74
-
75
-
76
-
77
-
78
-
79
-
80
-
81
-
82
-
83
-
84
-
85
-
86
-
87
-
88
-
89
-
90
-
91
-
92
-
93
-
94
-
95
-
96
-
97
-
98
-
99
-
100
-
101
-
102
-
103
-
104
-
105
-
106
-
107
-
108
-
109
-
110
-
111
-
112
-
113
-
114
-
115
-
116
-
117
-
118
-
119
-
120
-
121
-
122
-
123
-
124
-
125
-
126
-
127
-
128
-
129
-
130
-
131
-
132
-
133
-
134
-
135
-
136
-
137
-
138
-
139
-
140
-
141
-
142
-
143
-
144
-
145
-
146
-
147
-
148
-
149
-
150
-
151
-
152
-
153
-
154
-
155
-
156
-
157
-
158
-
159
-
160
-
161
-
162
-
163
-
164
-
165
-
166
-
167
-
168
-
169
-
170
-
171
-
172
-
173
-
174
-
175
-
176
-
177
-
178
-
179
-
180
-
181
-
182
-
183
-
184
-
185
-
186
-
187
-
188
-
189
-
190
-
191
-
192
-
193
-
194
-
195
-
196
-
197
-
198
-
199
-
200
 |
 |

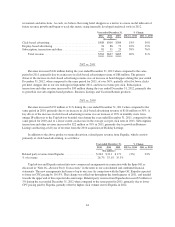
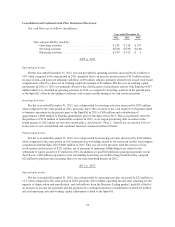
Technology and Content
Technology and content expenses consist of personnel and overhead expenses, including salaries and
benefits, stock-based compensation expense and bonuses for salaried employees and contractors engaged in the
design, development, testing and maintenance of our website. Other costs include licensing and maintenance
expense.
Year ended December 31, % Change
2012 2011 2010 2012 vs. 2011 2011 vs. 2010
($ in millions)
Personnel and overhead ............................... $ 80 $51 $40 56% 29%
Other .............................................. 7 6 3 7% 74%
Total technology and content ....................... $ 87 $57 $43 51% 33%
% of revenue ........................................ 11.4% 9.0% 8.9%
2012 vs. 2011
Technology and content costs increased $30 million during the year ended December 31, 2012 when
compared to the same period in 2011, primarily due to increased personnel costs from increased headcount to
support business growth, including international expansion, enhanced site features, extending our products onto
smartphone and tablet platforms, and development of our new hotel metasearch product, as well as an increase in
stock based compensation.
2011 vs. 2010
Technology and content costs increased $14 million during the year ended December 31, 2011 when
compared to the same period in 2010, primarily due to increased personnel costs from increased headcount to
support business expansion, including international site launches, enhanced site features and mobile initiatives.
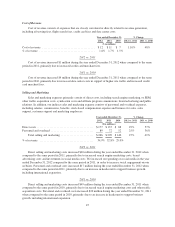
General and Administrative
General and administrative expense consists primarily of personnel and related overhead costs, including
executive leadership, finance, legal and human resource functions and stock-based compensation as well as
professional service fees and other fees including audit, legal, tax and accounting, and other costs including bad
debt expense and our charitable foundation costs.
Year ended December 31, % Change
2012 2011 2010 2012 vs. 2011 2011 vs. 2010
($ in millions)
Personnel and overhead ............................... $51 $37 $24 39% 52%
Professional service fees and other ...................... 25 8 8 203% 5%
Total general and administrative .................... $76 $45 $32 69% 41%
% of revenue ................................... 9.9% 7.0% 6.6%
2012 vs. 2011
General and administrative costs increased $31 million during the year ended December 31, 2012, when
compared to the same period in 2011, due to increased personnel and overhead costs related to an increase in
stock based compensation, as well as increased headcount to support business growth, and a full year of costs
related to additional headcount and professional service fees to support our operations as a standalone public
company in 2012. We also incurred increased professional service fees primarily related to legal and tax
initiatives. In addition, in connection with the Spin-Off, we assumed Expedia’s obligation to fund a charitable
foundation. Our expense related to the funding of this charitable foundation was $7 million for the year ended
December 31, 2012.
46