TripAdvisor 2012 Annual Report Download - page 115
Download and view the complete annual report
Please find page 115 of the 2012 TripAdvisor annual report below. You can navigate through the pages in the report by either clicking on the pages listed below, or by using the keyword search tool below to find specific information within the annual report.-
 1
1 -
2
-
3
-
4
-
5
-
6
-
7
-
8
-
9
-
10
-
11
-
12
-
13
-
14
-
15
-
16
-
17
-
18
-
19
-
20
-
21
-
22
-
23
-
24
-
25
-
26
-
27
-
28
-
29
-
30
-
31
-
32
-
33
-
34
-
35
-
36
-
37
-
38
-
39
-
40
-
41
-
42
-
43
-
44
-
45
-
46
-
47
-
48
-
49
-
50
-
51
-
52
-
53
-
54
-
55
-
56
-
57
-
58
-
59
-
60
-
61
-
62
-
63
-
64
-
65
-
66
-
67
-
68
-
69
-
70
-
71
-
72
-
73
-
74
-
75
-
76
-
77
-
78
-
79
-
80
-
81
-
82
-
83
-
84
-
85
-
86
-
87
-
88
-
89
-
90
-
91
-
92
-
93
-
94
-
95
-
96
-
97
-
98
-
99
-
100
-
101
-
102
-
103
-
104
-
 105
105 -
 106
106 -
 107
107 -
 108
108 -
 109
109 -
 110
110 -
 111
111 -
 112
112 -
 113
113 -
 114
114 -
 115
115 -
 116
116 -
 117
117 -
 118
118 -
 119
119 -
 120
120 -
 121
121 -
 122
122 -
 123
123 -
 124
124 -
 125
125 -
126
-
127
-
128
-
129
-
130
-
131
-
132
-
133
-
134
-
135
-
136
-
137
-
138
-
139
-
140
-
141
-
142
-
143
-
144
-
145
-
146
-
147
-
148
-
149
-
150
-
151
-
152
-
153
-
154
-
155
-
156
-
157
-
158
-
159
-
160
-
161
-
162
-
163
-
164
-
165
-
166
-
167
-
168
-
169
-
170
-
171
-
172
-
173
-
174
-
175
-
176
-
177
-
178
-
179
-
180
-
181
-
182
-
183
-
184
-
185
-
186
-
187
-
188
-
189
-
190
-
191
-
192
-
193
-
194
-
195
-
196
-
197
-
198
-
199
-
200
 |
 |

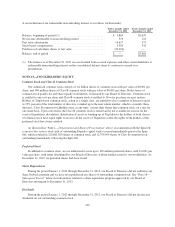
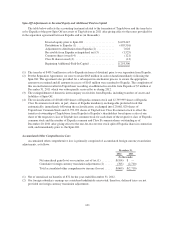
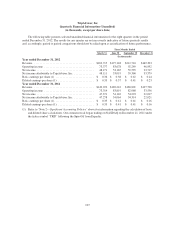
The following table is a reconciliation of Adjusted EBITDA to operating income and net income for the
periods presented:
Year ended December 31,
(in thousands)
2012 2011 2010
Adjusted EBITDA ................................. $352,474 $322,918 $260,963
Depreciation (1) .................................... (19,966) (18,362) (12,871)
OIBA (2) ......................................... 332,508 304,556 248,092
Amortization of intangible assets ...................... (6,110) (7,523) (14,609)
Stock-based compensation ............................ (30,102) (17,344) (7,183)
Spin-Off costs ..................................... — (6,932) —
Operating income .................................. 296,296 272,757 226,300
Interest income (expense), net ......................... (10,871) 391 (241)
Other, net ......................................... (3,450) (1,254) (1,644)
Provision for income taxes ........................... (87,387) (94,103) (85,461)
Net (income) loss attributable to noncontrolling interest .... (519) (114) (178)
Net income attributable to TripAdvisor, Inc ............ $194,069 $177,677 $138,776
(1) Includes internal use software and website development costs.
(2) Our primary operating metric prior to the Spin-Off for evaluating operating performance was OIBA, as
reported on our Registration Statement on Form S-4, filed with the SEC on November 1, 2011. OIBA is
defined as operating income plus: (1) amortization of intangible assets and any related impairment;
(2) stock-based compensation expense; and (3) non-recurring expenses incurred to effect the Spin-Off
during the year ended December 31, 2011. This operating metric is no longer being used by our
management to measure operating performance and is only being shown above to illustrate the financial
impact as we converted to a new operating metric post Spin-Off and is also currently used to calculate our
annual obligation for our charitable foundation. Refer to “Note 12—Commitments and Contingencies”
above for a discussion of our charitable foundation.
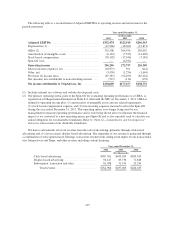
We derive substantially all of our revenue from the sale of advertising, primarily through click-based
advertising and, to a lesser extent, display-based advertising. The remainder of our revenue is generated through
a combination of subscription-based offerings, transaction revenue from selling room nights on our transactional
sites SniqueAway and Tingo, and other revenue including content licensing.
Year ended December 31,
2012 2011 2010
($ in thousands)
Click-based advertising ........................ $587,781 $499,993 $383,543
Display-based advertising ...................... 94,147 85,736 71,848
Subscription, transaction and other ............... 81,038 51,334 29,244
Total revenue ............................ $762,966 $637,063 $484,635
105