TripAdvisor 2012 Annual Report Download - page 53
Download and view the complete annual report
Please find page 53 of the 2012 TripAdvisor annual report below. You can navigate through the pages in the report by either clicking on the pages listed below, or by using the keyword search tool below to find specific information within the annual report.-
 1
1 -
2
-
3
-
4
-
5
-
6
-
7
-
8
-
9
-
10
-
11
-
12
-
13
-
14
-
15
-
16
-
17
-
18
-
19
-
20
-
21
-
22
-
23
-
24
-
25
-
26
-
27
-
28
-
29
-
30
-
31
-
32
-
33
-
34
-
35
-
36
-
37
-
38
-
39
-
40
-
41
-
42
-
 43
43 -
 44
44 -
 45
45 -
 46
46 -
 47
47 -
 48
48 -
 49
49 -
 50
50 -
 51
51 -
 52
52 -
 53
53 -
 54
54 -
 55
55 -
 56
56 -
 57
57 -
 58
58 -
 59
59 -
 60
60 -
 61
61 -
 62
62 -
 63
63 -
64
-
65
-
66
-
67
-
68
-
69
-
70
-
71
-
72
-
73
-
74
-
75
-
76
-
77
-
78
-
79
-
80
-
81
-
82
-
83
-
84
-
85
-
86
-
87
-
88
-
89
-
90
-
91
-
92
-
93
-
94
-
95
-
96
-
97
-
98
-
99
-
100
-
101
-
102
-
103
-
104
-
105
-
106
-
107
-
108
-
109
-
110
-
111
-
112
-
113
-
114
-
115
-
116
-
117
-
118
-
119
-
120
-
121
-
122
-
123
-
124
-
125
-
126
-
127
-
128
-
129
-
130
-
131
-
132
-
133
-
134
-
135
-
136
-
137
-
138
-
139
-
140
-
141
-
142
-
143
-
144
-
145
-
146
-
147
-
148
-
149
-
150
-
151
-
152
-
153
-
154
-
155
-
156
-
157
-
158
-
159
-
160
-
161
-
162
-
163
-
164
-
165
-
166
-
167
-
168
-
169
-
170
-
171
-
172
-
173
-
174
-
175
-
176
-
177
-
178
-
179
-
180
-
181
-
182
-
183
-
184
-
185
-
186
-
187
-
188
-
189
-
190
-
191
-
192
-
193
-
194
-
195
-
196
-
197
-
198
-
199
-
200
 |
 |

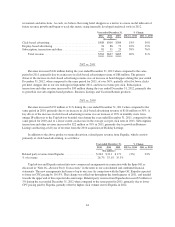
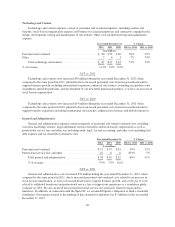
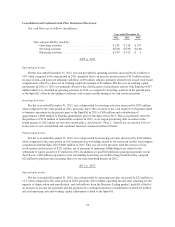
The following table is a reconciliation of Adjusted EBITDA to operating income, the most directly
comparable GAAP financial measure for the periods presented:
Year ended December 31,
(in thousands)
2012 2011 2010
Adjusted EBITDA ......................... $352,474 $322,918 $260,963
Depreciation (1) ............................ (19,966) (18,362) (12,871)
OIBA (2) ................................. 332,508 304,556 248,092
Amortization of intangible assets .............. (6,110) (7,523) (14,609)
Stock-based compensation .................... (30,102) (17,344) (7,183)
Spin-Off costs ............................. — (6,932) —
Operating income .......................... 296,296 272,757 226,300
(1) Includes internal use software and website development costs.
(2) Our primary operating metric prior to the Spin-Off for evaluating operating performance was Operating
Income Before Amortization, or OIBA, as reported on our Form S-4, filed with the SEC on November 1,
2011. OIBA is defined as operating income plus: (1) amortization of intangible assets and any related
impairment; (2) stock-based compensation expense; and (3) non-recurring expenses incurred to effect the
Spin-Off during the year ended December 31, 2011. This operating metric is no longer being used by our
management to measure operating performance and is only being shown above to illustrate the financial
impact as we converted to a new operating metric post Spin-Off and is also currently used to calculate our
annual obligation for our charitable foundation. Refer to, “Contractual Obligations, Commercial
Commitments and Off-Balance Sheet Arrangements”, below, in the section entitled “Management’s
Discussion and Analysis of Financial Condition and Results of Operations” in this Annual Report on Form
10-K for information on our charitable foundation.
Reclassifications
Certain reclassifications have been made to conform the prior period’s data to the current format, which
include the reclassifications of our redeemable noncontrolling interest on the consolidated balance sheets from
accrued expenses and other current liabilities and the reclassification of accrued marketing costs from accounts
payable to accrued expenses and other current liabilities. These reclassifications had no net effect on our
consolidated and combined financial statements.
Revenue
We derive substantially all of our revenue through the sale of advertising, primarily through click-based
advertising and, to a lesser extent, display-based advertising. In addition, we earn revenue through a combination
of subscription-based offerings related to our Business Listings and Vacation Rentals products, transaction
revenue from selling room nights on our transactional sites SniqueAway and Tingo, and other revenue including
content licensing.
The following discussion of revenue includes references to the number of unique Internet protocol, or IP,
addresses that visit TripAdvisor-branded sites each month. This metric is one of the metrics used by us to analyze
revenue and is measured using internally developed analytical tools. Each unique IP address is only counted the
first time it visits a TripAdvisor site during each calendar month. Our measurement of unique visitors does not
include any visitors to our subsidiary sites that are not TripAdvisor-branded, nor does it include any individuals
who view TripAdvisor content on other sites. While directionally indicative, unique IP address tracking has
recently become less valuable as a revenue growth metric because of the continually increasing diversification of
our site traffic and usage, particularly in light of our users’ engagement with non-hotel based site content, such as
43