TripAdvisor 2012 Annual Report Download - page 43
Download and view the complete annual report
Please find page 43 of the 2012 TripAdvisor annual report below. You can navigate through the pages in the report by either clicking on the pages listed below, or by using the keyword search tool below to find specific information within the annual report.-
 1
1 -
 2
2 -
 3
3 -
 4
4 -
 5
5 -
 6
6 -
 7
7 -
 8
8 -
 9
9 -
 10
10 -
 11
11 -
 12
12 -
 13
13 -
 14
14 -
 15
15 -
 16
16 -
 17
17 -
 18
18 -
 19
19 -
 20
20 -
 21
21 -
 22
22 -
 23
23 -
 24
24 -
 25
25 -
 26
26 -
 27
27 -
 28
28 -
 29
29 -
 30
30 -
 31
31 -
 32
32 -
 33
33 -
 34
34 -
 35
35 -
 36
36 -
 37
37 -
 38
38 -
 39
39 -
 40
40 -
 41
41 -
 42
42 -
 43
43 -
 44
44 -
 45
45 -
 46
46 -
 47
47 -
 48
48 -
 49
49 -
 50
50 -
 51
51 -
 52
52 -
 53
53 -
 54
54 -
 55
55 -
 56
56 -
 57
57 -
 58
58 -
 59
59 -
 60
60 -
 61
61 -
 62
62 -
 63
63 -
 64
64 -
 65
65 -
 66
66 -
 67
67 -
 68
68 -
 69
69 -
 70
70 -
 71
71 -
 72
72 -
 73
73 -
 74
74 -
 75
75 -
 76
76 -
 77
77 -
 78
78 -
 79
79 -
 80
80 -
 81
81 -
 82
82 -
 83
83 -
 84
84 -
 85
85 -
 86
86 -
 87
87 -
 88
88 -
 89
89 -
 90
90 -
 91
91 -
 92
92 -
 93
93 -
 94
94 -
 95
95 -
 96
96 -
 97
97 -
 98
98 -
 99
99 -
 100
100 -
 101
101 -
 102
102 -
 103
103 -
 104
104 -
 105
105 -
 106
106 -
 107
107 -
 108
108 -
 109
109 -
 110
110 -
 111
111 -
 112
112 -
 113
113 -
 114
114 -
 115
115 -
 116
116 -
 117
117 -
 118
118 -
 119
119 -
 120
120 -
 121
121 -
 122
122 -
 123
123 -
 124
124 -
 125
125 -
 126
126 -
 127
127 -
 128
128 -
 129
129 -
 130
130 -
 131
131 -
 132
132 -
 133
133 -
 134
134 -
 135
135 -
 136
136 -
 137
137 -
 138
138 -
 139
139 -
 140
140 -
 141
141 -
 142
142 -
 143
143 -
 144
144 -
 145
145 -
 146
146 -
 147
147 -
 148
148 -
 149
149 -
 150
150 -
 151
151 -
 152
152 -
 153
153 -
 154
154 -
 155
155 -
 156
156 -
 157
157 -
 158
158 -
 159
159 -
 160
160 -
 161
161 -
 162
162 -
 163
163 -
 164
164 -
 165
165 -
 166
166 -
 167
167 -
 168
168 -
 169
169 -
 170
170 -
 171
171 -
 172
172 -
 173
173 -
 174
174 -
 175
175 -
 176
176 -
 177
177 -
 178
178 -
 179
179 -
 180
180 -
 181
181 -
 182
182 -
 183
183 -
 184
184 -
 185
185 -
 186
186 -
 187
187 -
 188
188 -
 189
189 -
 190
190 -
 191
191 -
 192
192 -
 193
193 -
 194
194 -
 195
195 -
 196
196 -
 197
197 -
 198
198 -
 199
199 -
 200
200
 |
 |

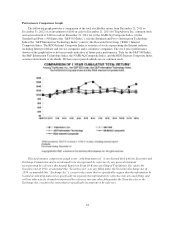
Performance Comparison Graph
The following graph provides a comparison of the total stockholder return from December 21, 2011 to
December 31, 2012 of an investment of $100 in cash on December 21, 2011 for TripAdvisor, Inc. common stock
and an investment of $100 in cash on December 21, 2011 for (i) the NASDAQ Composite Index, (ii) the
Standard and Poor’s 500 Index (the “S&P 500 Index”), (iii) the Standard and Poor’s Information Technology
Index (the “S&P Information Technology Index”) and (iv) the Research Data Group (“RDG”) Internet
Composite Index. The RDG Internet Composite Index is an index of stocks representing the Internet industry,
including Internet software and service companies and e-commerce companies. The stock price performance
shown on the graph below is not necessarily indicative of future price performance. Data for the S&P 500 Index,
the S&P Information Technology Index, the NASDAQ Composite Index, and the RDG Internet Composite Index
assume reinvestment of dividends. We have never paid dividends on our common stock.
This performance comparison graph is not “soliciting material,” is not deemed filed with the Securities and
Exchange Commission and is not deemed to be incorporated by reference by any general statement
incorporating by reference this Annual Report on Form 10-K into any filing of TripAdvisor, Inc. under the
Securities Act of 1933, as amended (the “Securities Act”), or any filing under the Securities Exchange Act of
1934, as amended (the “Exchange Act”), except to the extent that we specifically request that the information be
treated as soliciting material or specifically incorporate this information by reference into any such filing, and
will not otherwise be deemed incorporated by reference into any other filing under the Securities Act or the
Exchange Act, except to the extent that we specifically incorporate it by reference.
33
