TripAdvisor 2012 Annual Report Download - page 116
Download and view the complete annual report
Please find page 116 of the 2012 TripAdvisor annual report below. You can navigate through the pages in the report by either clicking on the pages listed below, or by using the keyword search tool below to find specific information within the annual report.-
 1
1 -
2
-
3
-
4
-
5
-
6
-
7
-
8
-
9
-
10
-
11
-
12
-
13
-
14
-
15
-
16
-
17
-
18
-
19
-
20
-
21
-
22
-
23
-
24
-
25
-
26
-
27
-
28
-
29
-
30
-
31
-
32
-
33
-
34
-
35
-
36
-
37
-
38
-
39
-
40
-
41
-
42
-
43
-
44
-
45
-
46
-
47
-
48
-
49
-
50
-
51
-
52
-
53
-
54
-
55
-
56
-
57
-
58
-
59
-
60
-
61
-
62
-
63
-
64
-
65
-
66
-
67
-
68
-
69
-
70
-
71
-
72
-
73
-
74
-
75
-
76
-
77
-
78
-
79
-
80
-
81
-
82
-
83
-
84
-
85
-
86
-
87
-
88
-
89
-
90
-
91
-
92
-
93
-
94
-
95
-
96
-
97
-
98
-
99
-
100
-
101
-
102
-
103
-
104
-
105
-
 106
106 -
 107
107 -
 108
108 -
 109
109 -
 110
110 -
 111
111 -
 112
112 -
 113
113 -
 114
114 -
 115
115 -
 116
116 -
 117
117 -
 118
118 -
 119
119 -
 120
120 -
 121
121 -
 122
122 -
 123
123 -
 124
124 -
 125
125 -
 126
126 -
127
-
128
-
129
-
130
-
131
-
132
-
133
-
134
-
135
-
136
-
137
-
138
-
139
-
140
-
141
-
142
-
143
-
144
-
145
-
146
-
147
-
148
-
149
-
150
-
151
-
152
-
153
-
154
-
155
-
156
-
157
-
158
-
159
-
160
-
161
-
162
-
163
-
164
-
165
-
166
-
167
-
168
-
169
-
170
-
171
-
172
-
173
-
174
-
175
-
176
-
177
-
178
-
179
-
180
-
181
-
182
-
183
-
184
-
185
-
186
-
187
-
188
-
189
-
190
-
191
-
192
-
193
-
194
-
195
-
196
-
197
-
198
-
199
-
200
 |
 |

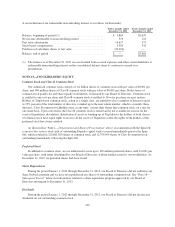
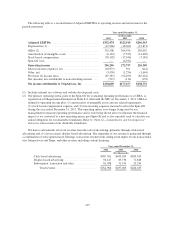
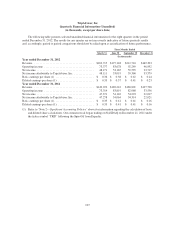
The following table presents revenue by geographic area, the United States, the United Kingdom and all
other countries, based on the geographic location of our websites for the years ended December 31, 2012, 2011
and 2010:
Year Ended December 31,
2012 2011 2010
(In thousands)
Revenue
United States ............................ $386,211 $348,066 $297,830
United Kingdom .......................... 110,213 99,646 69,721
All other countries ........................ 266,542 189,351 117,084
$762,966 $637,063 $484,635
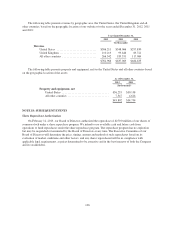
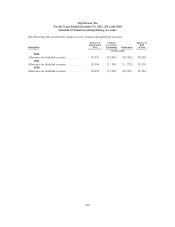
The following table presents property and equipment, net for the United States and all other countries based
on the geographic location of the assets:
As of December 31,
2012 2011
(In thousands)
Property and equipment, net
United States ................................. $36,255 $30,138
All other countries ............................. 7,547 4,616
$43,802 $34,754
NOTE 18: SUBSEQUENT EVENTS
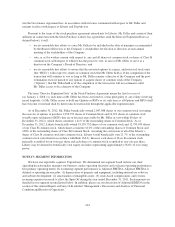
Share Repurchase Authorization
On February 12, 2013, our Board of Directors authorized the repurchase of $250.0 million of our shares of
common stock under a share repurchase program. We intend to use available cash and future cash from
operations to fund repurchases under the share repurchase program. The repurchase program has no expiration
but may be suspended or terminated by the Board of Directors at any time. The Executive Committee of our
Board of Directors will determine the price, timing, amount and method of such repurchases based on its
evaluation of market conditions and other factors, and any shares repurchased will be in compliance with
applicable legal requirements, at prices determined to be attractive and in the best interests of both the Company
and its stockholders.
106