TripAdvisor 2012 Annual Report Download - page 57
Download and view the complete annual report
Please find page 57 of the 2012 TripAdvisor annual report below. You can navigate through the pages in the report by either clicking on the pages listed below, or by using the keyword search tool below to find specific information within the annual report.-
 1
1 -
2
-
3
-
4
-
5
-
6
-
7
-
8
-
9
-
10
-
11
-
12
-
13
-
14
-
15
-
16
-
17
-
18
-
19
-
20
-
21
-
22
-
23
-
24
-
25
-
26
-
27
-
28
-
29
-
30
-
31
-
32
-
33
-
34
-
35
-
36
-
37
-
38
-
39
-
40
-
41
-
42
-
43
-
44
-
45
-
46
-
 47
47 -
 48
48 -
 49
49 -
 50
50 -
 51
51 -
 52
52 -
 53
53 -
 54
54 -
 55
55 -
 56
56 -
 57
57 -
 58
58 -
 59
59 -
 60
60 -
 61
61 -
 62
62 -
 63
63 -
 64
64 -
 65
65 -
 66
66 -
 67
67 -
68
-
69
-
70
-
71
-
72
-
73
-
74
-
75
-
76
-
77
-
78
-
79
-
80
-
81
-
82
-
83
-
84
-
85
-
86
-
87
-
88
-
89
-
90
-
91
-
92
-
93
-
94
-
95
-
96
-
97
-
98
-
99
-
100
-
101
-
102
-
103
-
104
-
105
-
106
-
107
-
108
-
109
-
110
-
111
-
112
-
113
-
114
-
115
-
116
-
117
-
118
-
119
-
120
-
121
-
122
-
123
-
124
-
125
-
126
-
127
-
128
-
129
-
130
-
131
-
132
-
133
-
134
-
135
-
136
-
137
-
138
-
139
-
140
-
141
-
142
-
143
-
144
-
145
-
146
-
147
-
148
-
149
-
150
-
151
-
152
-
153
-
154
-
155
-
156
-
157
-
158
-
159
-
160
-
161
-
162
-
163
-
164
-
165
-
166
-
167
-
168
-
169
-
170
-
171
-
172
-
173
-
174
-
175
-
176
-
177
-
178
-
179
-
180
-
181
-
182
-
183
-
184
-
185
-
186
-
187
-
188
-
189
-
190
-
191
-
192
-
193
-
194
-
195
-
196
-
197
-
198
-
199
-
200
 |
 |

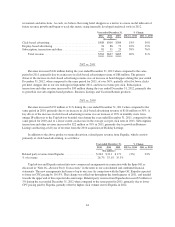
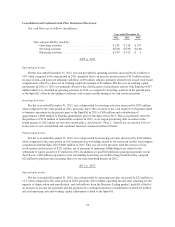
2011 vs. 2010
General and administrative costs increased $13 million during the year ended December 31, 2011, when
compared to the same period in 2010, primarily due to increased personnel costs from increased headcount as a
result of the Spin-Off to support business growth and additional hiring in order to support our operations as a
standalone public company and an additional $8 million in stock based compensation related to modification
charges in connection with the Spin-Off. Refer to “Note 4—Stock Based Awards and Other Equity Instruments”
in the notes to our consolidated and combined financial statements for information related to the stock-based
award modification charges.
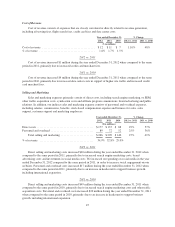
Related-Party Shared Services Fee
Prior to the Spin-Off, our related-party shared services fee was comprised of allocations from Expedia for
accounting, legal, tax, corporate development, treasury, financial reporting, real estate management and included
an allocation of employee compensation within these functions. These allocations were determined based on
what we and Expedia considered to be reasonable reflections of the utilization of services provided or the benefit
received by us.
Year ended December 31, % Change
2012 2011 2010 2012 vs. 2011 2011 vs. 2010
($ in millions)
Related-party shared services fee ........................ $— $ 9 $ 8 (100%) 17%
% of revenue ........................................ 0% 1.4% 1.6%
Related-party shared services fee costs incurred for the use of Expedia shared services ceased in connection
with the Spin-Off. Refer to “Note 16—Related Party Transactions” in the notes to our consolidated and
combined financial statements for further information on our relationship with Expedia.
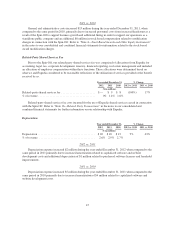
Depreciation
Year ended December 31, % Change
2012 2011 2010 2012 vs. 2011 2011 vs. 2010
($ in millions)
Depreciation ........................................ $20 $18 $13 9% 43%
% of revenue ....................................... 2.6% 2.9% 2.7%
2012 vs. 2011
Depreciation expense increased $2 million during the year ended December 31, 2012 when compared to the
same period in 2011 primarily due to increased amortization related to capitalized software and website
development costs and additional depreciation of $1 million related to purchased software licenses and leasehold
improvements.
2011 vs. 2010
Depreciation expense increased $5 million during the year ended December 31, 2011 when compared to the
same period in 2010 primarily due to increased amortization of $4 million related to capitalized software and
website development costs.
47