TripAdvisor 2012 Annual Report Download - page 63
Download and view the complete annual report
Please find page 63 of the 2012 TripAdvisor annual report below. You can navigate through the pages in the report by either clicking on the pages listed below, or by using the keyword search tool below to find specific information within the annual report.-
 1
1 -
2
-
3
-
4
-
5
-
6
-
7
-
8
-
9
-
10
-
11
-
12
-
13
-
14
-
15
-
16
-
17
-
18
-
19
-
20
-
21
-
22
-
23
-
24
-
25
-
26
-
27
-
28
-
29
-
30
-
31
-
32
-
33
-
34
-
35
-
36
-
37
-
38
-
39
-
40
-
41
-
42
-
43
-
44
-
45
-
46
-
47
-
48
-
49
-
50
-
51
-
52
-
 53
53 -
 54
54 -
 55
55 -
 56
56 -
 57
57 -
 58
58 -
 59
59 -
 60
60 -
 61
61 -
 62
62 -
 63
63 -
 64
64 -
 65
65 -
 66
66 -
 67
67 -
 68
68 -
 69
69 -
 70
70 -
 71
71 -
 72
72 -
 73
73 -
74
-
75
-
76
-
77
-
78
-
79
-
80
-
81
-
82
-
83
-
84
-
85
-
86
-
87
-
88
-
89
-
90
-
91
-
92
-
93
-
94
-
95
-
96
-
97
-
98
-
99
-
100
-
101
-
102
-
103
-
104
-
105
-
106
-
107
-
108
-
109
-
110
-
111
-
112
-
113
-
114
-
115
-
116
-
117
-
118
-
119
-
120
-
121
-
122
-
123
-
124
-
125
-
126
-
127
-
128
-
129
-
130
-
131
-
132
-
133
-
134
-
135
-
136
-
137
-
138
-
139
-
140
-
141
-
142
-
143
-
144
-
145
-
146
-
147
-
148
-
149
-
150
-
151
-
152
-
153
-
154
-
155
-
156
-
157
-
158
-
159
-
160
-
161
-
162
-
163
-
164
-
165
-
166
-
167
-
168
-
169
-
170
-
171
-
172
-
173
-
174
-
175
-
176
-
177
-
178
-
179
-
180
-
181
-
182
-
183
-
184
-
185
-
186
-
187
-
188
-
189
-
190
-
191
-
192
-
193
-
194
-
195
-
196
-
197
-
198
-
199
-
200
 |
 |

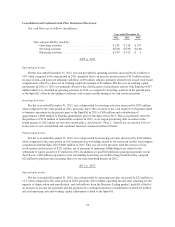
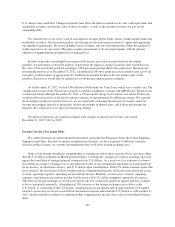
Consolidated and Combined Cash Flow Statements Discussion:
Our cash flows are as follows (in millions):
Year ended December 31,
2012 2011 2010
Net cash provided by (used in):
Operating activities ................................ $239 $218 $197
Investing activities ................................ $(244) $(539) $(140)
Financing activities ................................ $190 $412 $ 4
2012 vs. 2011
Operating Activities
For the year ended December 31, 2012, net cash provided by operating activities increased by $21 million or
10% when compared to the same period in 2011, primarily due to an increase in net income of $17 million and an
increase in non-cash items not affecting cash flows of $9 million, which is primarily related to increased stock based
compensation, offset by a decrease in working capital movements of $5 million. The decrease in working capital
movements in 2012 vs. 2011 was primarily driven by the classification of related party activity with Expedia of $17
million which was classified in operating activities in 2012, as compared to investing activities in the periods prior
to the Spin-Off, offset by the timing of customer cash receipts and the timing of tax and vendor payments.
Investing Activities
For the year ended December 31, 2012, net cash provided by investing activities increased by $295 million
when compared to the same period in 2011, primarily due to the cessation of net cash transfers to Expedia related
to business operations in the periods prior to the Spin-Off in 2011 of $96 million and a distribution of
approximately $406 million to Expedia immediately prior to the Spin-Off in 2011. This was primarily offset by
the purchase of $219 million of marketable securities in 2012, as we began purchasing debt securities in the
fourth quarter of 2012 under our new investment policy, described in “Note 2—Significant Accounting Policies”
in the notes to our consolidated and combined financial statements in Item 8 below.
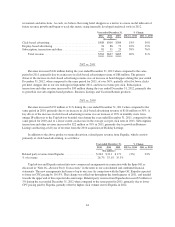
Financing Activities
For the year ended December 31, 2012, net cash provided by financing activities decreased by $222 million
when compared to the same period in 2011 primarily due to funding related to our term loan facility borrowing in
conjunction with the Spin-Off of $400 million in 2011. This was offset by proceeds from the exercise of our
stock options and warrants of $231 million, net of payment of minimum withholding taxes related to the
settlement of equity awards of $7 million in 2012. In addition we paid $20 million in principal payments on our
Term Loan, a $10 million repayment of our outstanding borrowing on our Revolving Credit Facility, and paid
$22 million to purchase the remaining shares of our noncontrolling interest in 2012.
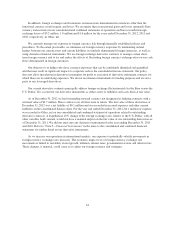
2011 vs. 2010
Operating Activities
For the year ended December 31, 2011, net cash provided by operating activities increased by $21 million or
11% when compared to the same period in 2010, primarily due to higher operating income after adjusting for the
impacts of depreciation and amortization, and cash inflows from the Business Listing product, partially offset by
an increase in income tax payments and the payment of a contingent purchase consideration of which $3 million
affected operating cash and working capital adjustments related to the Spin-Off.
53