TripAdvisor 2012 Annual Report Download - page 58
Download and view the complete annual report
Please find page 58 of the 2012 TripAdvisor annual report below. You can navigate through the pages in the report by either clicking on the pages listed below, or by using the keyword search tool below to find specific information within the annual report.-
 1
1 -
2
-
3
-
4
-
5
-
6
-
7
-
8
-
9
-
10
-
11
-
12
-
13
-
14
-
15
-
16
-
17
-
18
-
19
-
20
-
21
-
22
-
23
-
24
-
25
-
26
-
27
-
28
-
29
-
30
-
31
-
32
-
33
-
34
-
35
-
36
-
37
-
38
-
39
-
40
-
41
-
42
-
43
-
44
-
45
-
46
-
47
-
 48
48 -
 49
49 -
 50
50 -
 51
51 -
 52
52 -
 53
53 -
 54
54 -
 55
55 -
 56
56 -
 57
57 -
 58
58 -
 59
59 -
 60
60 -
 61
61 -
 62
62 -
 63
63 -
 64
64 -
 65
65 -
 66
66 -
 67
67 -
 68
68 -
69
-
70
-
71
-
72
-
73
-
74
-
75
-
76
-
77
-
78
-
79
-
80
-
81
-
82
-
83
-
84
-
85
-
86
-
87
-
88
-
89
-
90
-
91
-
92
-
93
-
94
-
95
-
96
-
97
-
98
-
99
-
100
-
101
-
102
-
103
-
104
-
105
-
106
-
107
-
108
-
109
-
110
-
111
-
112
-
113
-
114
-
115
-
116
-
117
-
118
-
119
-
120
-
121
-
122
-
123
-
124
-
125
-
126
-
127
-
128
-
129
-
130
-
131
-
132
-
133
-
134
-
135
-
136
-
137
-
138
-
139
-
140
-
141
-
142
-
143
-
144
-
145
-
146
-
147
-
148
-
149
-
150
-
151
-
152
-
153
-
154
-
155
-
156
-
157
-
158
-
159
-
160
-
161
-
162
-
163
-
164
-
165
-
166
-
167
-
168
-
169
-
170
-
171
-
172
-
173
-
174
-
175
-
176
-
177
-
178
-
179
-
180
-
181
-
182
-
183
-
184
-
185
-
186
-
187
-
188
-
189
-
190
-
191
-
192
-
193
-
194
-
195
-
196
-
197
-
198
-
199
-
200
 |
 |

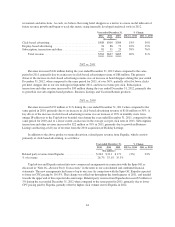
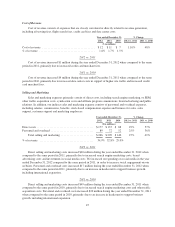
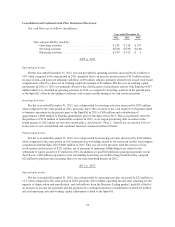
Amortization of Intangible Assets
Year ended December 31, % Change
2012 2011 2010 2012 vs. 2011 2011 vs. 2010
($ in millions)
Amortization of intangible assets ....................... $ 6 $ 8 $15 (19%) (49% )
% of revenue ....................................... 0.8% 1.2% 3.0%
2012 vs. 2011
Amortization of intangible assets decreased $2 million during the year ended December 31, 2012 when
compared to the same period in 2011, primarily due to the completion of amortization related to certain
technology intangible assets.
2011 vs. 2010
Amortization of intangible assets decreased $7 million during the year ended December 31, 2011 when
compared to the same period in 2010, primarily due to the completion of amortization of $3 million related to
certain technology intangible assets and a decrease in amortization of $4 million related to the contingent
purchase consideration for the acquisition of Holiday Lettings in June 2010.
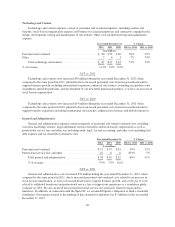
Operating Income
Year ended December 31, % Change
2012 2011 2010 2012 vs. 2011 2011 vs. 2011
($ in millions)
Operating income ................................... $296 $273 $226 9% 21%
% of revenue ...................................... 38.8% 42.8% 46.7%
2012 vs. 2011
Operating income increased $23 million for the year ended December 31, 2012 when compared to the same
period in 2011, primarily due to an increase in revenue of $126 million or 20%, which was partially offset by a
corresponding increase to operating expenses of $103 million or 28%, respectively, particularly due to increased
headcount and personnel costs to support business growth, including related stock based compensation, key
initiatives, international expansion and operations as a standalone public company, and increased traffic
acquisition costs to drive higher revenue.
2011 vs. 2010
Operating income increased $47 million for the year ended December 31, 2011 when compared to the same
period in 2010, primarily due to an increase in revenue of $152 million or 31%, which was partially offset by a
corresponding increase to operating expenses of $106 million or 41%, particularly in personnel costs to support
business growth and traffic acquisition costs to drive higher revenue. Also included in total operating costs for
the year ended December 31, 2011 is $7 million of costs incurred as part of the Spin-Off from Expedia, which
will be non-recurring for 2012.
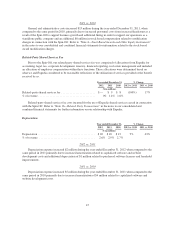
Interest (Expense) Income, Net
Interest expense is primarily related to interest incurred on our Term Loan and credit facilities for the year
ending December 31, 2012. Amounts for the years ending December 31, 2011 and 2010 were not material.
48