TripAdvisor 2012 Annual Report Download - page 59
Download and view the complete annual report
Please find page 59 of the 2012 TripAdvisor annual report below. You can navigate through the pages in the report by either clicking on the pages listed below, or by using the keyword search tool below to find specific information within the annual report.-
 1
1 -
2
-
3
-
4
-
5
-
6
-
7
-
8
-
9
-
10
-
11
-
12
-
13
-
14
-
15
-
16
-
17
-
18
-
19
-
20
-
21
-
22
-
23
-
24
-
25
-
26
-
27
-
28
-
29
-
30
-
31
-
32
-
33
-
34
-
35
-
36
-
37
-
38
-
39
-
40
-
41
-
42
-
43
-
44
-
45
-
46
-
47
-
48
-
 49
49 -
 50
50 -
 51
51 -
 52
52 -
 53
53 -
 54
54 -
 55
55 -
 56
56 -
 57
57 -
 58
58 -
 59
59 -
 60
60 -
 61
61 -
 62
62 -
 63
63 -
 64
64 -
 65
65 -
 66
66 -
 67
67 -
 68
68 -
 69
69 -
70
-
71
-
72
-
73
-
74
-
75
-
76
-
77
-
78
-
79
-
80
-
81
-
82
-
83
-
84
-
85
-
86
-
87
-
88
-
89
-
90
-
91
-
92
-
93
-
94
-
95
-
96
-
97
-
98
-
99
-
100
-
101
-
102
-
103
-
104
-
105
-
106
-
107
-
108
-
109
-
110
-
111
-
112
-
113
-
114
-
115
-
116
-
117
-
118
-
119
-
120
-
121
-
122
-
123
-
124
-
125
-
126
-
127
-
128
-
129
-
130
-
131
-
132
-
133
-
134
-
135
-
136
-
137
-
138
-
139
-
140
-
141
-
142
-
143
-
144
-
145
-
146
-
147
-
148
-
149
-
150
-
151
-
152
-
153
-
154
-
155
-
156
-
157
-
158
-
159
-
160
-
161
-
162
-
163
-
164
-
165
-
166
-
167
-
168
-
169
-
170
-
171
-
172
-
173
-
174
-
175
-
176
-
177
-
178
-
179
-
180
-
181
-
182
-
183
-
184
-
185
-
186
-
187
-
188
-
189
-
190
-
191
-
192
-
193
-
194
-
195
-
196
-
197
-
198
-
199
-
200
 |
 |

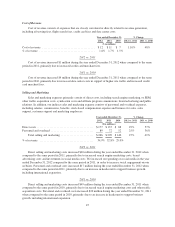
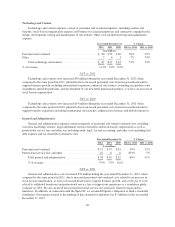
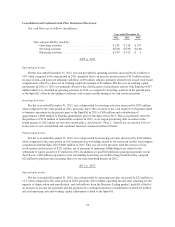
Other, Net
Other, net is primarily comprised of net foreign exchange losses for the periods presented.
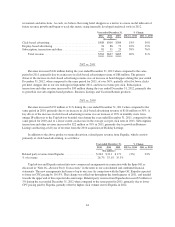
Provision for Income Taxes
Year ended December 31, % Change
2012 2011 2010 2012 vs. 2011 2011 vs. 2010
($ in millions)
Provision for income taxes ............................ $ 87 $ 94 $ 85 (7%) 10%
Effective tax rate ................................... 31.0% 34.6% 38.1%
2012 vs. 2011
Our effective tax rate was lower than the 35% federal statutory rate primarily due to earnings in jurisdictions
outside the United States, where our effective tax rate is lower, which was partially offset by state income taxes
and accruals on uncertain tax positions. The change in the effective rate for 2012 compared to the 2011 rate was
primarily due to an increase in earnings in jurisdictions outside the United States and a decrease in state income
taxes, as well as the internal restructuring.
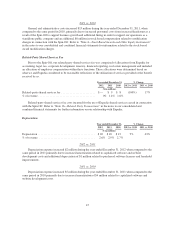
2011 vs. 2010
Our effective tax rate was lower than the 35% federal statutory rate primarily due to earnings in jurisdictions
outside the United States, where our effective tax rate is lower, which was partially offset by state income taxes,
accruals on uncertain tax positions, increases in valuation allowances, and non-deductible transaction costs
associated with the Spin-Off. The change in the effective rate for 2011 compared to the 2010 rate was primarily
due to an increase in earnings in jurisdictions outside the United States and a decrease in state income taxes
partially offset by non-deductible transaction costs.
Financial Position, Liquidity and Capital Resources
Our principal sources of liquidity are cash flows generated from operations. As of December 31, 2012 we
had $586 million of cash, cash equivalents and short and long-term available-for-sale marketable securities and at
December 31, 2011 we had $184 million of cash and cash equivalents. As of December 31, 2012 approximately
$311 million of our cash, cash equivalents and short and long-term marketable securities are held by our
international subsidiaries, primarily in the United Kingdom, and are related to earnings we intend to reinvest
permanently outside the United States. Should we distribute earnings of foreign subsidiaries in the form of
dividends or otherwise, we may be subject to U.S. income taxes. Cumulative undistributed earnings of foreign
subsidiaries that we intend to indefinitely reinvest outside of the United States totaled approximately $372
million as of December 31, 2012. Should we distribute, or be treated under certain U.S. tax rules as having
distributed, the earnings of foreign subsidiaries in the form of dividends or otherwise, we may be subject to U.S.
income taxes. Determination of the amount of any unrecognized deferred income tax liability on this temporary
difference is not practicable because of the complexities of the hypothetical calculation. Cash held is primarily
denominated in U.S. dollars.
Historically, the cash we generate has been sufficient to fund our working capital requirements, capital
expenditures and to meet our long term debt obligations and commitments. Management believes that our cash
and cash equivalents, combined with expected cash flows generated by operating activities and available cash
from our credit facilities will be sufficient to fund our ongoing working capital requirements, capital
expenditures, business growth initiatives, meet our long term debt obligations and commitments, and fund any
potential acquisitions for at least the next 12 months. However, if during that period or thereafter, we are not
successful in generating sufficient cash flow from operations or in raising additional capital when required in
sufficient amounts and on terms acceptable to us, we may be required to reduce our planned capital expenditures
49