TripAdvisor 2012 Annual Report Download - page 54
Download and view the complete annual report
Please find page 54 of the 2012 TripAdvisor annual report below. You can navigate through the pages in the report by either clicking on the pages listed below, or by using the keyword search tool below to find specific information within the annual report.-
 1
1 -
2
-
3
-
4
-
5
-
6
-
7
-
8
-
9
-
10
-
11
-
12
-
13
-
14
-
15
-
16
-
17
-
18
-
19
-
20
-
21
-
22
-
23
-
24
-
25
-
26
-
27
-
28
-
29
-
30
-
31
-
32
-
33
-
34
-
35
-
36
-
37
-
38
-
39
-
40
-
41
-
42
-
43
-
 44
44 -
 45
45 -
 46
46 -
 47
47 -
 48
48 -
 49
49 -
 50
50 -
 51
51 -
 52
52 -
 53
53 -
 54
54 -
 55
55 -
 56
56 -
 57
57 -
 58
58 -
 59
59 -
 60
60 -
 61
61 -
 62
62 -
 63
63 -
 64
64 -
65
-
66
-
67
-
68
-
69
-
70
-
71
-
72
-
73
-
74
-
75
-
76
-
77
-
78
-
79
-
80
-
81
-
82
-
83
-
84
-
85
-
86
-
87
-
88
-
89
-
90
-
91
-
92
-
93
-
94
-
95
-
96
-
97
-
98
-
99
-
100
-
101
-
102
-
103
-
104
-
105
-
106
-
107
-
108
-
109
-
110
-
111
-
112
-
113
-
114
-
115
-
116
-
117
-
118
-
119
-
120
-
121
-
122
-
123
-
124
-
125
-
126
-
127
-
128
-
129
-
130
-
131
-
132
-
133
-
134
-
135
-
136
-
137
-
138
-
139
-
140
-
141
-
142
-
143
-
144
-
145
-
146
-
147
-
148
-
149
-
150
-
151
-
152
-
153
-
154
-
155
-
156
-
157
-
158
-
159
-
160
-
161
-
162
-
163
-
164
-
165
-
166
-
167
-
168
-
169
-
170
-
171
-
172
-
173
-
174
-
175
-
176
-
177
-
178
-
179
-
180
-
181
-
182
-
183
-
184
-
185
-
186
-
187
-
188
-
189
-
190
-
191
-
192
-
193
-
194
-
195
-
196
-
197
-
198
-
199
-
200
 |
 |

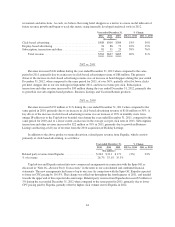
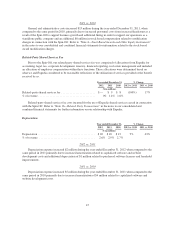
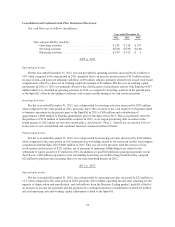
restaurants and attractions. As such, we believe that using hotel shoppers as a metric is a more useful indicator of
future revenue growth and began to track this metric using internally developed analytical tools in 2012.
Year ended December 31, % Change
2012 2011 2010 2012 vs. 2011 2011 vs. 2010
($ in millions)
Click-based advertising ................................ $588 $500 $384 18% 30%
Display-based advertising .............................. 94 86 72 10% 19%
Subscription, transaction and other ....................... 81 51 29 58% 76%
Total revenue .................................... $763 $637 $485 20% 31%
2012 vs. 2011
Revenue increased $126 million during the year ended December 31, 2012 when compared to the same
period in 2011, primarily due to an increase in click-based advertising revenue of $88 million. The primary
driver of the increase in click-based advertising revenue was an increase in hotel shoppers during the year ended
December 31, 2012, when compared to the same period for 2011, of over 30%, partially offset by lower clicks
per hotel shopper due to our site redesign in September 2011, and lower revenue per click. Subscription,
transaction and other revenue increased by $30 million during the year ended December 31, 2012, primarily due
to growth in our subscription based products, Business Listings and Vacation Rentals products.
2011 vs. 2010
Revenue increased $152 million or 31% during the year ended December 31, 2011 when compared to the
same period in 2010, primarily due to an increase in click-based advertising revenue of $116 million or 30%. A
key driver of the increase in click-based advertising revenue was an increase of 29% in monthly visits from
unique IP addresses to the TripAdvisor branded sites during the year ended December 31, 2011, compared to the
same period for 2010 and, to a lesser extent, an increase in the average cost per click rates in 2011. Subscription,
transaction and other revenue increased by $22 million or 76% in 2011, primarily due to growth in Business
Listings and having a full year of revenue from the 2010 acquisition of Holiday Lettings.
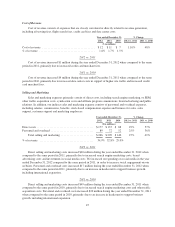
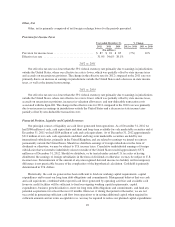
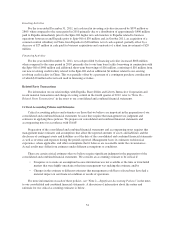
In addition to the above product revenue discussion, related-party revenue from Expedia, which consists
primarily of click-based advertising, is as follows:
Year ended December 31, % Change
2012 2011 2010 2012 vs. 2011 2011 vs. 2010
($ in millions)
Related party revenue from Expedia .................... $204 $211 $171 (3%) 23%
% of revenue ...................................... 26.7% 33.1% 35.3%
TripAdvisor and Expedia entered into new commercial arrangements in connection with the Spin-Off, as
discussed in “Note 16—Related Party Transactions” in the notes to our consolidated and combined financial
statements. The new arrangements had terms of up to one year. In connection with the Spin-Off, Expedia expected
to lower its CPC pricing by 10-15%. This change was rolled out throughout the fourth quarter of 2011, and trended
towards the upper end of this expected discount range. Related-party revenue from Expedia decreased $7 million or
3% during the year ended December 31, 2012 when compared to the same period in 2011, primarily due to lower
CPC pricing paid by Expedia, partially offset by higher click volume sent to Expedia in 2012.
44