Travelers 2007 Annual Report Download - page 98
Download and view the complete annual report
Please find page 98 of the 2007 Travelers annual report below. You can navigate through the pages in the report by either clicking on the pages listed below, or by using the keyword search tool below to find specific information within the annual report.-
 1
1 -
2
-
3
-
4
-
5
-
6
-
7
-
8
-
9
-
10
-
11
-
12
-
13
-
14
-
15
-
16
-
17
-
18
-
19
-
20
-
21
-
22
-
23
-
24
-
25
-
26
-
27
-
28
-
29
-
30
-
31
-
32
-
33
-
34
-
35
-
36
-
37
-
38
-
39
-
40
-
41
-
42
-
43
-
44
-
45
-
46
-
47
-
48
-
49
-
50
-
51
-
52
-
53
-
54
-
55
-
56
-
57
-
58
-
59
-
60
-
61
-
62
-
63
-
64
-
65
-
66
-
67
-
68
-
69
-
70
-
71
-
72
-
73
-
74
-
75
-
76
-
77
-
78
-
79
-
80
-
81
-
82
-
83
-
84
-
85
-
86
-
87
-
 88
88 -
 89
89 -
 90
90 -
 91
91 -
 92
92 -
 93
93 -
 94
94 -
 95
95 -
 96
96 -
 97
97 -
 98
98 -
 99
99 -
 100
100 -
 101
101 -
 102
102 -
 103
103 -
 104
104 -
 105
105 -
 106
106 -
 107
107 -
 108
108 -
109
-
110
-
111
-
112
-
113
-
114
-
115
-
116
-
117
-
118
-
119
-
120
-
121
-
122
-
123
-
124
-
125
-
126
-
127
-
128
-
129
-
130
-
131
-
132
-
133
-
134
-
135
-
136
-
137
-
138
-
139
-
140
-
141
-
142
-
143
-
144
-
145
-
146
-
147
-
148
-
149
-
150
-
151
-
152
-
153
-
154
-
155
-
156
-
157
-
158
-
159
-
160
-
161
-
162
-
163
-
164
-
165
-
166
-
167
-
168
-
169
-
170
-
171
-
172
-
173
-
174
-
175
-
176
-
177
-
178
-
179
-
180
-
181
-
182
-
183
-
184
-
185
-
186
-
187
-
188
-
189
-
190
-
191
-
192
-
193
-
194
-
195
-
196
-
197
-
198
-
199
-
200
-
201
-
202
-
203
-
204
-
205
-
206
-
207
-
208
-
209
-
210
-
211
-
212
-
213
-
214
-
215
-
216
-
217
-
218
-
219
-
220
-
221
-
222
-
223
-
224
-
225
-
226
-
227
-
228
-
229
-
230
-
231
-
232
-
233
-
234
-
235
-
236
-
237
-
238
-
239
-
240
-
241
-
242
-
243
-
244
-
245
-
246
-
247
-
248
-
249
-
250
-
251
-
252
-
253
-
254
-
255
-
256
-
257
-
258
-
259
-
260
-
261
-
262
-
263
-
264
-
265
-
266
-
267
-
268
-
269
-
270
-
271
-
272
-
273
-
274
-
275
-
276
-
277
-
278
-
279
-
280
 |
 |

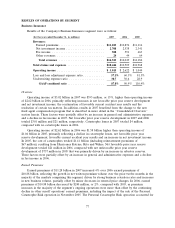
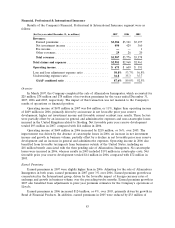
$33 million of catastrophe-related reinstatement premiums, primarily related to the Company’s
operations at Lloyd’s.
Personal Insurance
Results of the Company’s Personal Insurance segment were as follows:
(for the year ended December 31, in millions) 2007 2006 2005
Revenues:
Earned premiums ......................................... $6,803 $6,563 $6,028
Net investment income ...................................... 559 548 457
Other revenues ........................................... 90 94 96
Total revenues ............................................ $7,452 $7,205 $6,581
Total claims and expenses ..................................... $5,996 $5,555 $5,464
Operating income ........................................... $1,019 $1,132 $ 775
Loss and loss adjustment expense ratio ............................ 58.6% 54.8% 62.2%
Underwriting expense ratio .................................... 28.2 28.3 26.9
GAAP combined ratio ...................................... 86.8% 83.1% 89.1%
Overview
In April 2007, the Company completed the sale of its subsidiary, Mendota Insurance Company,
and its wholly-owned subsidiaries, Mendakota Insurance Company and Mendota Insurance Agency, Inc.
(collectively, Mendota). These subsidiaries primarily offered nonstandard automobile coverage and
accounted for $49 million, $187 million and $137 million of net written premiums in the years ended
December 31, 2007, 2006 and 2005, respectively. The impact of this transaction was not material to the
Company’s results of operations or financial position.
Operating income of $1.02 billion in 2007 was $113 million, or 10%, lower than operating income
of $1.13 billion in 2006, primarily reflecting a decline in net favorable prior year reserve development
and an increase in catastrophe losses, partially offset by growth in business volume and net investment
income. In addition, results in 2007 benefited from the Company’s implementation of a new fixed agent
compensation program, which is described in more detail in the ‘‘Consolidated Overview’’ section
herein. Net favorable prior year reserve development in 2007 and 2006 totaled $152 million and
$359 million, respectively. Catastrophe losses in 2007 totaled $163 million, compared with catastrophe
losses of $103 million in 2006.
Operating income of $1.13 billion in 2006 was $357 million, or 46%, higher than operating income
of $775 million in 2005. Results in 2006 reflected a significant decline in catastrophe losses, strong
growth in business volume, continued favorable current accident year loss trends and an increase in net
investment income, partially offset by an increase in general and administrative expenses. Catastrophe
losses in 2006 totaled $103 million, compared with a cost of catastrophes of $593 million in 2005.
Results in both 2006 and 2005 benefited from significant net favorable prior year reserve development,
which totaled $359 million and $360 million, respectively.
Earned Premiums
Earned premiums of $6.80 billion in 2007 grew 4% over 2006, primarily reflecting continued strong
business retention rates, increases in renewal price changes, and growth from new business volume over
the preceding twelve months, partially offset by the impact of the sale of Mendota in early April 2007.
Excluding the impact of Mendota in both years, earned premiums in 2007 increased 6% over 2006. In
2006, earned premiums of $6.56 billion increased 9% over the 2005 total of $6.03 billion, primarily due
86