Travelers 2007 Annual Report Download - page 110
Download and view the complete annual report
Please find page 110 of the 2007 Travelers annual report below. You can navigate through the pages in the report by either clicking on the pages listed below, or by using the keyword search tool below to find specific information within the annual report.-
 1
1 -
2
-
3
-
4
-
5
-
6
-
7
-
8
-
9
-
10
-
11
-
12
-
13
-
14
-
15
-
16
-
17
-
18
-
19
-
20
-
21
-
22
-
23
-
24
-
25
-
26
-
27
-
28
-
29
-
30
-
31
-
32
-
33
-
34
-
35
-
36
-
37
-
38
-
39
-
40
-
41
-
42
-
43
-
44
-
45
-
46
-
47
-
48
-
49
-
50
-
51
-
52
-
53
-
54
-
55
-
56
-
57
-
58
-
59
-
60
-
61
-
62
-
63
-
64
-
65
-
66
-
67
-
68
-
69
-
70
-
71
-
72
-
73
-
74
-
75
-
76
-
77
-
78
-
79
-
80
-
81
-
82
-
83
-
84
-
85
-
86
-
87
-
88
-
89
-
90
-
91
-
92
-
93
-
94
-
95
-
96
-
97
-
98
-
99
-
 100
100 -
 101
101 -
 102
102 -
 103
103 -
 104
104 -
 105
105 -
 106
106 -
 107
107 -
 108
108 -
 109
109 -
 110
110 -
 111
111 -
 112
112 -
 113
113 -
 114
114 -
 115
115 -
 116
116 -
 117
117 -
 118
118 -
 119
119 -
 120
120 -
121
-
122
-
123
-
124
-
125
-
126
-
127
-
128
-
129
-
130
-
131
-
132
-
133
-
134
-
135
-
136
-
137
-
138
-
139
-
140
-
141
-
142
-
143
-
144
-
145
-
146
-
147
-
148
-
149
-
150
-
151
-
152
-
153
-
154
-
155
-
156
-
157
-
158
-
159
-
160
-
161
-
162
-
163
-
164
-
165
-
166
-
167
-
168
-
169
-
170
-
171
-
172
-
173
-
174
-
175
-
176
-
177
-
178
-
179
-
180
-
181
-
182
-
183
-
184
-
185
-
186
-
187
-
188
-
189
-
190
-
191
-
192
-
193
-
194
-
195
-
196
-
197
-
198
-
199
-
200
-
201
-
202
-
203
-
204
-
205
-
206
-
207
-
208
-
209
-
210
-
211
-
212
-
213
-
214
-
215
-
216
-
217
-
218
-
219
-
220
-
221
-
222
-
223
-
224
-
225
-
226
-
227
-
228
-
229
-
230
-
231
-
232
-
233
-
234
-
235
-
236
-
237
-
238
-
239
-
240
-
241
-
242
-
243
-
244
-
245
-
246
-
247
-
248
-
249
-
250
-
251
-
252
-
253
-
254
-
255
-
256
-
257
-
258
-
259
-
260
-
261
-
262
-
263
-
264
-
265
-
266
-
267
-
268
-
269
-
270
-
271
-
272
-
273
-
274
-
275
-
276
-
277
-
278
-
279
-
280
 |
 |

resolution or adjudication of some disputes pertaining to the amount of available coverage for asbestos
and environmental claims in a manner inconsistent with the Company’s previous assessment of these
claims, the number and outcome of direct actions against the Company and future developments
pertaining to the Company’s ability to recover reinsurance for asbestos and environmental claims. The
Company’s asbestos-related claims and claim adjustment expense experience has been impacted by the
unavailability of other insurance sources potentially available to policyholders, whether through
exhaustion of policy limits or insolvency. In addition, uncertainties arise from the insolvency or
bankruptcy of other defendants, although the Company has noted a decrease in the number and
volatility of asbestos-related bankruptcies. It is also not possible to predict changes in the legal,
regulatory and legislative environment and their impact on the future development of asbestos and
environmental claims. This development will be affected by future court and regulatory decisions and
interpretations, as well as changes in applicable legislation. It is also difficult to predict the ultimate
outcome of complex coverage disputes until settlement negotiations near completion and significant
legal questions are resolved or, failing settlement, until the dispute is adjudicated. This is particularly
the case with policyholders in bankruptcy where negotiations often involve a large number of claimants
and other parties and require court approval to be effective. As part of its continuing analysis of
asbestos and environmental reserves, the Company continues to study the implications of these and
other developments. (Also, see ‘‘Part I—Item 3, Legal Proceedings’’).
Because of the uncertainties set forth above, additional liabilities may arise for amounts in excess
of the current related reserves. In addition, the Company’s estimate of claims and claim adjustment
expenses may change. These additional liabilities or increases in estimates, or a range of either, cannot
now be reasonably estimated and could result in income statement charges that could be material to
the Company’s operating results in future periods.
INVESTMENT PORTFOLIO
The Company’s invested assets at December 31, 2007 totaled $74.82 billion, of which 94% was
invested in fixed maturity and short-term investments, 1% in equity securities, 1% in real estate and
4% in other investments. Because the primary purpose of the investment portfolio is to fund future
claims payments, the Company employs a conservative investment philosophy. The Company’s fixed
maturity portfolio at December 31, 2007 totaled $64.92 billion, comprising $64.50 billion of publicly
traded fixed maturities and $420 million of private fixed maturities. The weighted average quality
ratings of the Company’s publicly traded fixed maturity portfolio and private fixed maturity portfolio at
December 31, 2007 were Aa1 and A3, respectively. Included in the fixed maturity portfolio at that date
was approximately $1.64 billion of below investment grade securities. During 2007, holdings of
tax-exempt securities were increased to $38.55 billion to take advantage of their relatively high credit
quality and attractive after-tax yields. The average effective duration of the fixed maturity portfolio,
including short-term investments, was 4.0 (4.3 excluding short-term investments), at both December 31,
2007 and 2006.
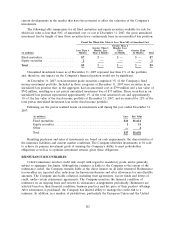
The following table sets forth the Company’s combined fixed maturity investment portfolio rated
using external ratings agencies or by the Company when a public rating does not exist:
Carrying Percent of Total
(at December 31, 2007, in millions) Value Carrying Value
Quality Rating:
Aaa ....................................... $43,946 67.7%
Aa ........................................ 11,827 18.2
A......................................... 4,343 6.7
Baa ....................................... 3,163 4.9
Total investment grade .......................... 63,279 97.5
Non-investment grade .......................... 1,641 2.5
Total fixed maturity investments ................... $64,920 100.0%
98