Travelers 2007 Annual Report Download - page 231
Download and view the complete annual report
Please find page 231 of the 2007 Travelers annual report below. You can navigate through the pages in the report by either clicking on the pages listed below, or by using the keyword search tool below to find specific information within the annual report.-
 1
1 -
2
-
3
-
4
-
5
-
6
-
7
-
8
-
9
-
10
-
11
-
12
-
13
-
14
-
15
-
16
-
17
-
18
-
19
-
20
-
21
-
22
-
23
-
24
-
25
-
26
-
27
-
28
-
29
-
30
-
31
-
32
-
33
-
34
-
35
-
36
-
37
-
38
-
39
-
40
-
41
-
42
-
43
-
44
-
45
-
46
-
47
-
48
-
49
-
50
-
51
-
52
-
53
-
54
-
55
-
56
-
57
-
58
-
59
-
60
-
61
-
62
-
63
-
64
-
65
-
66
-
67
-
68
-
69
-
70
-
71
-
72
-
73
-
74
-
75
-
76
-
77
-
78
-
79
-
80
-
81
-
82
-
83
-
84
-
85
-
86
-
87
-
88
-
89
-
90
-
91
-
92
-
93
-
94
-
95
-
96
-
97
-
98
-
99
-
100
-
101
-
102
-
103
-
104
-
105
-
106
-
107
-
108
-
109
-
110
-
111
-
112
-
113
-
114
-
115
-
116
-
117
-
118
-
119
-
120
-
121
-
122
-
123
-
124
-
125
-
126
-
127
-
128
-
129
-
130
-
131
-
132
-
133
-
134
-
135
-
136
-
137
-
138
-
139
-
140
-
141
-
142
-
143
-
144
-
145
-
146
-
147
-
148
-
149
-
150
-
151
-
152
-
153
-
154
-
155
-
156
-
157
-
158
-
159
-
160
-
161
-
162
-
163
-
164
-
165
-
166
-
167
-
168
-
169
-
170
-
171
-
172
-
173
-
174
-
175
-
176
-
177
-
178
-
179
-
180
-
181
-
182
-
183
-
184
-
185
-
186
-
187
-
188
-
189
-
190
-
191
-
192
-
193
-
194
-
195
-
196
-
197
-
198
-
199
-
200
-
201
-
202
-
203
-
204
-
205
-
206
-
207
-
208
-
209
-
210
-
211
-
212
-
213
-
214
-
215
-
216
-
217
-
218
-
219
-
220
-
 221
221 -
 222
222 -
 223
223 -
 224
224 -
 225
225 -
 226
226 -
 227
227 -
 228
228 -
 229
229 -
 230
230 -
 231
231 -
 232
232 -
 233
233 -
 234
234 -
 235
235 -
 236
236 -
 237
237 -
 238
238 -
 239
239 -
 240
240 -
 241
241 -
242
-
243
-
244
-
245
-
246
-
247
-
248
-
249
-
250
-
251
-
252
-
253
-
254
-
255
-
256
-
257
-
258
-
259
-
260
-
261
-
262
-
263
-
264
-
265
-
266
-
267
-
268
-
269
-
270
-
271
-
272
-
273
-
274
-
275
-
276
-
277
-
278
-
279
-
280
 |
 |

THE TRAVELERS COMPANIES, INC. AND SUBSIDIARIES
NOTES TO CONSOLIDATED FINANCIAL STATEMENTS (Continued)
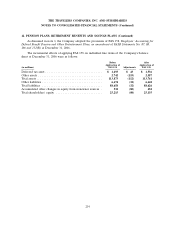
12. PENSION PLANS, RETIREMENT BENEFITS AND SAVINGS PLANS (Continued)
Plan Assets
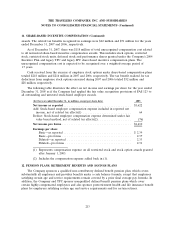
The percentage of the fair value of pension plan assets held by asset category is as follows:
(at December 31,) 2007 2006
Equity securities ......................................... 63% 65%
Debt securities .......................................... 30% 29%
Cash .................................................. 5% 4%
Other ................................................. 2% 2%
Total ................................................ 100% 100%
Pension plan assets are invested for the exclusive benefit of the plan participants and beneficiaries
and are intended, over time, to satisfy the benefit obligations under the plan. Risk tolerance is
established through consideration of plan liabilities, plan funded status, and corporate financial
position. The asset mix guidelines have been established and are reviewed quarterly. These guidelines
are intended to serve as tools to facilitate the investment of plan assets to maximize long-term total
return and the ongoing oversight of the plan’s investment performance. The investment portfolio
contains a diversified mix of equity and fixed-income investments. Equity investments are diversified
across U.S. and non-U.S. stocks. Other assets such as partnerships and real estate are used to enhance
long-term returns while improving portfolio diversification. Investment risk is measured and monitored
on an ongoing basis through daily and monthly investment portfolio review, annual liability
measurements, and periodic asset/liability studies.
Maximum and minimum targets for asset allocations at December 31, 2007 by asset category were
as follows:
Asset Category Plan Assets
Equity securities .......................................... 25 - 75%
Fixed maturity securities .................................... 15 - 75%
Cash .................................................. 0 - 20%
Other ................................................. 0 - 10%
Equity securities include 797,600 shares of the Company’s common stock with a market value of
$43 million at December 31, 2007.
The Company’s other post-retirement benefit plan weighted-average asset allocations at
December 31, 2007 and 2006 by asset category were as follows:
Asset Category 2007 2006
Fixed maturity securities ................................... 62% 68%
Cash .................................................. 34% 28%
Equity securities ......................................... 4% 4%
219