Travelers 2007 Annual Report Download - page 92
Download and view the complete annual report
Please find page 92 of the 2007 Travelers annual report below. You can navigate through the pages in the report by either clicking on the pages listed below, or by using the keyword search tool below to find specific information within the annual report.-
 1
1 -
2
-
3
-
4
-
5
-
6
-
7
-
8
-
9
-
10
-
11
-
12
-
13
-
14
-
15
-
16
-
17
-
18
-
19
-
20
-
21
-
22
-
23
-
24
-
25
-
26
-
27
-
28
-
29
-
30
-
31
-
32
-
33
-
34
-
35
-
36
-
37
-
38
-
39
-
40
-
41
-
42
-
43
-
44
-
45
-
46
-
47
-
48
-
49
-
50
-
51
-
52
-
53
-
54
-
55
-
56
-
57
-
58
-
59
-
60
-
61
-
62
-
63
-
64
-
65
-
66
-
67
-
68
-
69
-
70
-
71
-
72
-
73
-
74
-
75
-
76
-
77
-
78
-
79
-
80
-
81
-
 82
82 -
 83
83 -
 84
84 -
 85
85 -
 86
86 -
 87
87 -
 88
88 -
 89
89 -
 90
90 -
 91
91 -
 92
92 -
 93
93 -
 94
94 -
 95
95 -
 96
96 -
 97
97 -
 98
98 -
 99
99 -
 100
100 -
 101
101 -
 102
102 -
103
-
104
-
105
-
106
-
107
-
108
-
109
-
110
-
111
-
112
-
113
-
114
-
115
-
116
-
117
-
118
-
119
-
120
-
121
-
122
-
123
-
124
-
125
-
126
-
127
-
128
-
129
-
130
-
131
-
132
-
133
-
134
-
135
-
136
-
137
-
138
-
139
-
140
-
141
-
142
-
143
-
144
-
145
-
146
-
147
-
148
-
149
-
150
-
151
-
152
-
153
-
154
-
155
-
156
-
157
-
158
-
159
-
160
-
161
-
162
-
163
-
164
-
165
-
166
-
167
-
168
-
169
-
170
-
171
-
172
-
173
-
174
-
175
-
176
-
177
-
178
-
179
-
180
-
181
-
182
-
183
-
184
-
185
-
186
-
187
-
188
-
189
-
190
-
191
-
192
-
193
-
194
-
195
-
196
-
197
-
198
-
199
-
200
-
201
-
202
-
203
-
204
-
205
-
206
-
207
-
208
-
209
-
210
-
211
-
212
-
213
-
214
-
215
-
216
-
217
-
218
-
219
-
220
-
221
-
222
-
223
-
224
-
225
-
226
-
227
-
228
-
229
-
230
-
231
-
232
-
233
-
234
-
235
-
236
-
237
-
238
-
239
-
240
-
241
-
242
-
243
-
244
-
245
-
246
-
247
-
248
-
249
-
250
-
251
-
252
-
253
-
254
-
255
-
256
-
257
-
258
-
259
-
260
-
261
-
262
-
263
-
264
-
265
-
266
-
267
-
268
-
269
-
270
-
271
-
272
-
273
-
274
-
275
-
276
-
277
-
278
-
279
-
280
 |
 |

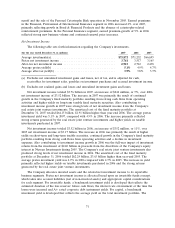
net favorable prior year reserve development in 2006, compared with net unfavorable prior year reserve
development in 2005. Catastrophe losses accounted for 12.3 points of the 2005 loss and loss adjustment
expense ratio. Net favorable prior year reserve development in 2006 provided a 0.2 point benefit to the
loss and loss adjustment expense ratio, whereas net unfavorable prior year reserve development in 2005
accounted for 6.8 points of the loss and loss adjustment expense ratio. Excluding catastrophe losses and
prior year reserve development, the 2006 loss and loss adjustment expense ratio improved 1.9 points
over the comparable 2005 ratio, reflecting improvement in frequency and severity trends in several lines
of business in 2006.
The underwriting expense ratio of 30.7% in 2007, which included a 0.7 point benefit resulting from
the implementation of the new fixed agent compensation program, was 0.1 points higher than the 2006
ratio, reflecting the increases in general and administrative expenses described above, and the impact of
a decline in fee income. A portion of fee income is accounted for as a reduction of expenses for
purposes of calculating the expense ratio. The underwriting expense ratio for 2006 was 1.7 points
higher than the 2005 ratio, primarily reflecting the increases in general and administrative expenses
described above, and the impact of declines in fee income. Catastrophe-related reinstatement premiums
of $67 million and catastrophe-related state assessments of $18 million added 0.3 points to the 2005
expense ratio.
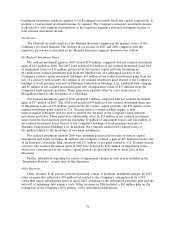
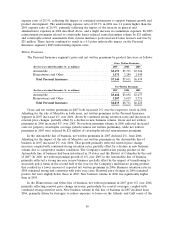
Written Premiums
The Business Insurance segment’s gross and net written premiums by market were as follows:
Gross Written Premiums
(for the year ended December 31, in millions) 2007 2006 2005
Select Accounts ............................. $ 2,774 $ 2,733 $ 2,799
Commercial Accounts ........................ 2,740 2,613 2,535
National Accounts ........................... 1,859 2,169 2,627
Industry-Focused Underwriting .................. 2,380 2,279 2,154
Target Risk Underwriting ...................... 2,182 2,187 2,040
Specialized Distribution ....................... 1,033 1,036 920
Total Business Insurance Core ................ 12,968 13,017 13,075
Business Insurance Other ...................... 49 30 378
Total Business Insurance .................... $13,017 $13,047 $13,453
Net Written Premiums
(for the year ended December 31, in millions) 2007 2006 2005
Select Accounts ............................. $ 2,711 $ 2,663 $ 2,722
Commercial Accounts ........................ 2,518 2,376 2,330
National Accounts ........................... 1,056 1,135 1,230
Industry-Focused Underwriting .................. 2,301 2,196 2,080
Target Risk Underwriting ...................... 1,665 1,629 1,482
Specialized Distribution ....................... 1,015 1,022 908
Total Business Insurance Core ................ 11,266 11,021 10,752
Business Insurance Other ...................... 52 25 247
Total Business Insurance .................... $11,318 $11,046 $10,999
In Business Insurance Core, gross written premiums in 2007 declined $49 million, or less than 1%,
from the comparable 2006 total, whereas net written premiums increased $245 million, or 2%,
compared with 2006. The difference in growth rates between gross and net written premiums in 2007
80