Travelers 2007 Annual Report Download - page 96
Download and view the complete annual report
Please find page 96 of the 2007 Travelers annual report below. You can navigate through the pages in the report by either clicking on the pages listed below, or by using the keyword search tool below to find specific information within the annual report.-
 1
1 -
2
-
3
-
4
-
5
-
6
-
7
-
8
-
9
-
10
-
11
-
12
-
13
-
14
-
15
-
16
-
17
-
18
-
19
-
20
-
21
-
22
-
23
-
24
-
25
-
26
-
27
-
28
-
29
-
30
-
31
-
32
-
33
-
34
-
35
-
36
-
37
-
38
-
39
-
40
-
41
-
42
-
43
-
44
-
45
-
46
-
47
-
48
-
49
-
50
-
51
-
52
-
53
-
54
-
55
-
56
-
57
-
58
-
59
-
60
-
61
-
62
-
63
-
64
-
65
-
66
-
67
-
68
-
69
-
70
-
71
-
72
-
73
-
74
-
75
-
76
-
77
-
78
-
79
-
80
-
81
-
82
-
83
-
84
-
85
-
 86
86 -
 87
87 -
 88
88 -
 89
89 -
 90
90 -
 91
91 -
 92
92 -
 93
93 -
 94
94 -
 95
95 -
 96
96 -
 97
97 -
 98
98 -
 99
99 -
 100
100 -
 101
101 -
 102
102 -
 103
103 -
 104
104 -
 105
105 -
 106
106 -
107
-
108
-
109
-
110
-
111
-
112
-
113
-
114
-
115
-
116
-
117
-
118
-
119
-
120
-
121
-
122
-
123
-
124
-
125
-
126
-
127
-
128
-
129
-
130
-
131
-
132
-
133
-
134
-
135
-
136
-
137
-
138
-
139
-
140
-
141
-
142
-
143
-
144
-
145
-
146
-
147
-
148
-
149
-
150
-
151
-
152
-
153
-
154
-
155
-
156
-
157
-
158
-
159
-
160
-
161
-
162
-
163
-
164
-
165
-
166
-
167
-
168
-
169
-
170
-
171
-
172
-
173
-
174
-
175
-
176
-
177
-
178
-
179
-
180
-
181
-
182
-
183
-
184
-
185
-
186
-
187
-
188
-
189
-
190
-
191
-
192
-
193
-
194
-
195
-
196
-
197
-
198
-
199
-
200
-
201
-
202
-
203
-
204
-
205
-
206
-
207
-
208
-
209
-
210
-
211
-
212
-
213
-
214
-
215
-
216
-
217
-
218
-
219
-
220
-
221
-
222
-
223
-
224
-
225
-
226
-
227
-
228
-
229
-
230
-
231
-
232
-
233
-
234
-
235
-
236
-
237
-
238
-
239
-
240
-
241
-
242
-
243
-
244
-
245
-
246
-
247
-
248
-
249
-
250
-
251
-
252
-
253
-
254
-
255
-
256
-
257
-
258
-
259
-
260
-
261
-
262
-
263
-
264
-
265
-
266
-
267
-
268
-
269
-
270
-
271
-
272
-
273
-
274
-
275
-
276
-
277
-
278
-
279
-
280
 |
 |
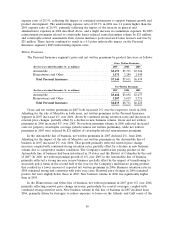
reinstatement premiums related to catastrophe losses, primarily in the Company’s operations at Lloyd’s.
Earned premium volume in International in 2006 declined slightly from 2005, primarily reflecting the
elimination of a one-month reporting lag at Lloyd’s in 2005 that resulted in $48 million of additional
earned premiums being included in 2005 results. Also contributing to the decline in earned premiums
in International in 2006 was the sale of certain classes of personal lines business at Lloyd’s in the first
quarter of 2005, which had accounted for $43 million of earned premiums in 2005.
Net Investment Income
Refer to the ‘‘Net Investment Income’’ section of the ‘‘Consolidated Results of Operations’’
discussion herein for a description of the factors contributing to the increase in the Company’s net
investment income in 2007 and 2006.
Claims and Expenses
Claims and claim adjustment expenses totaled $1.74 billion in 2007, a decrease of 3% from 2006,
primarily reflecting an increase in net favorable prior year reserve development and the impact of the
sale of Afianzadora Insurgentes, partially offset by the increase in business volume, $37 million of
non-catastrophe losses incurred in the United Kingdom in 2007 related to flooding and the impact of
foreign currency rates of exchange. Net favorable prior year reserve development in 2007 totaled
$93 million, compared to $14 million in 2006. The net favorable development in 2007 primarily
reflected better than expected loss development in international property, employers’ liability,
professional indemnity and motor lines of business for recent accident years, which was attributable to
several factors, including enhanced pricing and underwriting strategies throughout the International
operations, and the favorable impact of legal and judicial reforms in Ireland.
Claims and claim adjustment expenses in 2006 totaled $1.79 billion, a decrease of 1% from 2005.
The 2006 total included no catastrophe losses and $14 million of net favorable prior year reserve
development, whereas the 2005 total included $158 million of catastrophe losses and $72 million of net
favorable prior year reserve development. Net favorable prior year reserve development in 2005 was
attributable to the better than anticipated favorable impact from changes in underwriting and pricing
strategies for International property-related exposures.
General and administrative expenses totaled $590 million in 2007, an increase of 10% over the
2006 of $536 million. The increase primarily reflected the segment’s continued expenditures to support
business growth and the impact of foreign currency exchange rates. The Company’s implementation of
a new fixed agent compensation program in the first quarter of 2007 did not have a material impact on
this segment. General and administrative expenses in 2006 increased by 5% over the 2005 total of
$509 million. The increase primarily reflected the segment’s expenditures to support business growth
and the segment’s share of costs associated with the Company’s national advertising campaign and legal
expenses related to investigations of various business practices by certain governmental agencies.
GAAP Combined Ratio
The loss and loss adjustment expense ratio of 50.8% in 2007 was 2.9 points lower than the 2006
ratio of 53.7%. The 2007 ratio included a 2.7 point benefit from net favorable prior year reserve
development, compared with a 0.4 point benefit in 2006. Excluding this factor in each year, the 2007
ratio was slightly lower than the 2006 ratio. The loss and loss adjustment expense ratio in 2006 was 3.1
points lower than the ratio of 56.8% in 2005. The 2006 ratio included no impact of catastrophe losses
and a 0.4 point benefit from net favorable prior year reserve development, whereas the 2005 ratio
included a 5.5 point impact from catastrophes and a 2.3 point benefit from net favorable prior year
reserve development. Excluding those factors in each year, the 2006 ratio was slightly higher than the
2005 ratio.
84