Travelers 2007 Annual Report Download - page 82
Download and view the complete annual report
Please find page 82 of the 2007 Travelers annual report below. You can navigate through the pages in the report by either clicking on the pages listed below, or by using the keyword search tool below to find specific information within the annual report.-
 1
1 -
2
-
3
-
4
-
5
-
6
-
7
-
8
-
9
-
10
-
11
-
12
-
13
-
14
-
15
-
16
-
17
-
18
-
19
-
20
-
21
-
22
-
23
-
24
-
25
-
26
-
27
-
28
-
29
-
30
-
31
-
32
-
33
-
34
-
35
-
36
-
37
-
38
-
39
-
40
-
41
-
42
-
43
-
44
-
45
-
46
-
47
-
48
-
49
-
50
-
51
-
52
-
53
-
54
-
55
-
56
-
57
-
58
-
59
-
60
-
61
-
62
-
63
-
64
-
65
-
66
-
67
-
68
-
69
-
70
-
71
-
 72
72 -
 73
73 -
 74
74 -
 75
75 -
 76
76 -
 77
77 -
 78
78 -
 79
79 -
 80
80 -
 81
81 -
 82
82 -
 83
83 -
 84
84 -
 85
85 -
 86
86 -
 87
87 -
 88
88 -
 89
89 -
 90
90 -
 91
91 -
 92
92 -
93
-
94
-
95
-
96
-
97
-
98
-
99
-
100
-
101
-
102
-
103
-
104
-
105
-
106
-
107
-
108
-
109
-
110
-
111
-
112
-
113
-
114
-
115
-
116
-
117
-
118
-
119
-
120
-
121
-
122
-
123
-
124
-
125
-
126
-
127
-
128
-
129
-
130
-
131
-
132
-
133
-
134
-
135
-
136
-
137
-
138
-
139
-
140
-
141
-
142
-
143
-
144
-
145
-
146
-
147
-
148
-
149
-
150
-
151
-
152
-
153
-
154
-
155
-
156
-
157
-
158
-
159
-
160
-
161
-
162
-
163
-
164
-
165
-
166
-
167
-
168
-
169
-
170
-
171
-
172
-
173
-
174
-
175
-
176
-
177
-
178
-
179
-
180
-
181
-
182
-
183
-
184
-
185
-
186
-
187
-
188
-
189
-
190
-
191
-
192
-
193
-
194
-
195
-
196
-
197
-
198
-
199
-
200
-
201
-
202
-
203
-
204
-
205
-
206
-
207
-
208
-
209
-
210
-
211
-
212
-
213
-
214
-
215
-
216
-
217
-
218
-
219
-
220
-
221
-
222
-
223
-
224
-
225
-
226
-
227
-
228
-
229
-
230
-
231
-
232
-
233
-
234
-
235
-
236
-
237
-
238
-
239
-
240
-
241
-
242
-
243
-
244
-
245
-
246
-
247
-
248
-
249
-
250
-
251
-
252
-
253
-
254
-
255
-
256
-
257
-
258
-
259
-
260
-
261
-
262
-
263
-
264
-
265
-
266
-
267
-
268
-
269
-
270
-
271
-
272
-
273
-
274
-
275
-
276
-
277
-
278
-
279
-
280
 |
 |
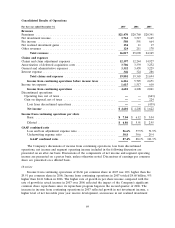
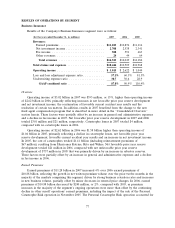
gains, favorable current accident year results and increased business volume, partially offset by an
increase in expenses and a decline in fee income. Net favorable prior year reserve development totaled
$546 million in 2007, compared with net favorable prior year reserve development of $394 million in
2006. Expenses in 2007 included a net benefit of $163 million due to the implementation of a new
fixed, value-based compensation program for the majority of the Company’s agents, which resulted in a
reduction in commission expense compared to what would have otherwise been reported, due to a
change in the timing of expense recognition compared with 2006. Catastrophe losses in 2007 totaled
$167 million, compared with $103 million in 2006. Income from continuing operations in both 2007 and
2006 included after-tax benefits of $86 million due to the favorable resolution of various prior year tax
matters. The 2007 total also included net realized investment gains of $154 million, compared with net
realized investment gains of $11 million in 2006.
Income from continuing operations in 2006 totaled $4.21 billion, or $5.91 per share, compared with
2005 income from continuing operations of $2.06 billion, or $2.95 per share. The $2.15 billion increase
in 2006 operating results reflected a significant decline in catastrophe losses, net favorable prior year
reserve development, strong growth in net investment income and higher business volume. These
factors were partially offset by an increase in general and administrative expenses and a decline in fee
income. Catastrophe losses in 2006 totaled $103 million, whereas results in 2005 included $2.19 billion
of catastrophe costs, primarily resulting from Hurricanes Katrina, Rita and Wilma. Net favorable prior
year reserve development totaled $394 million in 2006, compared with net unfavorable prior year
reserve development of $325 million in 2005.
In 2005, the Company sold its equity interest in Nuveen Investments, which constituted its Asset
Management segment. The Company recorded a net loss from discontinued operations of $439 million,
consisting primarily of $710 million of tax expense which resulted from the difference between the tax
basis and the GAAP carrying value of the Company’s investment in Nuveen Investments, partially
offset by the $224 million after-tax gain on the divestiture and the Company’s share of Nuveen
Investments’ net income for 2005.
Revenues
Earned Premiums
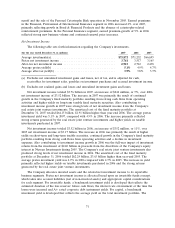
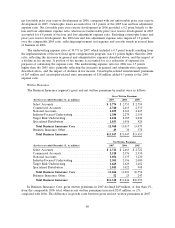
Earned premiums in 2007 totaled $21.47 billion, an increase of $710 million, or 3%, over 2006. In
the Business Insurance segment, earned premium growth of 4% in 2007 over 2006 primarily reflected
the impact of the growth in business volume over the preceding twelve months. In the Financial,
Professional & International Insurance segment, earned premium growth of 2% in 2007 over 2006 was
driven by the favorable impact of foreign currency rates of exchange, growth in business volume and a
benefit from adjustments to prior year premium estimates for the Company’s operations at Lloyd’s,
partially offset by the impact of the sale of the Company’s Mexican surety subsidiary, Afianzadora
Insurgentes, S.A. de C.V. (Afianzadora Insurgentes), in late March 2007. In the Personal Insurance
segment, earned premium growth of 4% in 2007 over 2006 reflected continued strong business
retention rates, continued renewal price increases and growth from new business volumes over the
preceding twelve months, partially offset by the impact of the sale of Mendota Insurance Company and
its subsidiaries (collectively, Mendota) in early April 2007.
Earned premiums in 2006 totaled $20.76 billion, an increase of $419 million, or 2%, over the 2005
total of $20.34 billion. Earned premiums in 2006 were negatively impacted by an increase in property
catastrophe reinsurance costs. Earned premiums in 2005 were reduced by $121 million of reinstatement
premiums, which represent additional premiums payable to reinsurers to restore coverage limits that
had been exhausted as a result of reinsured losses under certain excess-of-loss reinsurance treaties
related to Hurricanes Katrina, Rita and Wilma. In the Business Insurance segment, earned premiums
in 2006 declined 2% from the comparable 2005 total, primarily reflecting the impact of business in
70