Travelers 2007 Annual Report Download - page 81
Download and view the complete annual report
Please find page 81 of the 2007 Travelers annual report below. You can navigate through the pages in the report by either clicking on the pages listed below, or by using the keyword search tool below to find specific information within the annual report.-
 1
1 -
2
-
3
-
4
-
5
-
6
-
7
-
8
-
9
-
10
-
11
-
12
-
13
-
14
-
15
-
16
-
17
-
18
-
19
-
20
-
21
-
22
-
23
-
24
-
25
-
26
-
27
-
28
-
29
-
30
-
31
-
32
-
33
-
34
-
35
-
36
-
37
-
38
-
39
-
40
-
41
-
42
-
43
-
44
-
45
-
46
-
47
-
48
-
49
-
50
-
51
-
52
-
53
-
54
-
55
-
56
-
57
-
58
-
59
-
60
-
61
-
62
-
63
-
64
-
65
-
66
-
67
-
68
-
69
-
70
-
 71
71 -
 72
72 -
 73
73 -
 74
74 -
 75
75 -
 76
76 -
 77
77 -
 78
78 -
 79
79 -
 80
80 -
 81
81 -
 82
82 -
 83
83 -
 84
84 -
 85
85 -
 86
86 -
 87
87 -
 88
88 -
 89
89 -
 90
90 -
 91
91 -
92
-
93
-
94
-
95
-
96
-
97
-
98
-
99
-
100
-
101
-
102
-
103
-
104
-
105
-
106
-
107
-
108
-
109
-
110
-
111
-
112
-
113
-
114
-
115
-
116
-
117
-
118
-
119
-
120
-
121
-
122
-
123
-
124
-
125
-
126
-
127
-
128
-
129
-
130
-
131
-
132
-
133
-
134
-
135
-
136
-
137
-
138
-
139
-
140
-
141
-
142
-
143
-
144
-
145
-
146
-
147
-
148
-
149
-
150
-
151
-
152
-
153
-
154
-
155
-
156
-
157
-
158
-
159
-
160
-
161
-
162
-
163
-
164
-
165
-
166
-
167
-
168
-
169
-
170
-
171
-
172
-
173
-
174
-
175
-
176
-
177
-
178
-
179
-
180
-
181
-
182
-
183
-
184
-
185
-
186
-
187
-
188
-
189
-
190
-
191
-
192
-
193
-
194
-
195
-
196
-
197
-
198
-
199
-
200
-
201
-
202
-
203
-
204
-
205
-
206
-
207
-
208
-
209
-
210
-
211
-
212
-
213
-
214
-
215
-
216
-
217
-
218
-
219
-
220
-
221
-
222
-
223
-
224
-
225
-
226
-
227
-
228
-
229
-
230
-
231
-
232
-
233
-
234
-
235
-
236
-
237
-
238
-
239
-
240
-
241
-
242
-
243
-
244
-
245
-
246
-
247
-
248
-
249
-
250
-
251
-
252
-
253
-
254
-
255
-
256
-
257
-
258
-
259
-
260
-
261
-
262
-
263
-
264
-
265
-
266
-
267
-
268
-
269
-
270
-
271
-
272
-
273
-
274
-
275
-
276
-
277
-
278
-
279
-
280
 |
 |

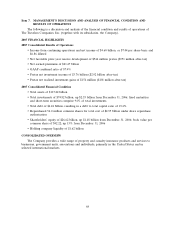
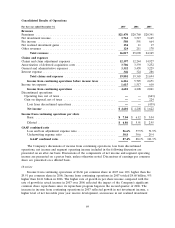
Consolidated Results of Operations
For the year ended December 31, 2007 2006 2005
Revenues
Premiums .............................................. $21,470 $20,760 $20,341
Net investment income ..................................... 3,761 3,517 3,165
Fee income ............................................. 508 591 664
Net realized investment gains ................................ 154 11 17
Other revenues .......................................... 124 211 178
Total revenues ...................................... 26,017 25,090 24,365
Claims and expenses
Claims and claim adjustment expenses .......................... 12,397 12,244 14,927
Amortization of deferred acquisition costs ....................... 3,706 3,339 3,252
General and administrative expenses ........................... 3,352 3,458 3,229
Interest expense .......................................... 346 324 286
Total claims and expenses ............................. 19,801 19,365 21,694
Income from continuing operations before income taxes ......... 6,216 5,725 2,671
Income tax expense ....................................... 1,615 1,517 610
Income from continuing operations ........................ 4,601 4,208 2,061
Discontinued operations:
Operating loss, net of taxes ................................ —— (663)
Gain on disposal, net of taxes .............................. —— 224
Loss from discontinued operations ......................... —— (439)
Net income .......................................... $ 4,601 $ 4,208 $ 1,622
Income from continuing operations per share
Basic .............................................. $ 7.04 $ 6.12 $ 3.04
Diluted ............................................. $ 6.86 $ 5.91 $ 2.95
GAAP combined ratio
Loss and loss adjustment expense ratio ...................... 56.6% 57.5% 71.9%
Underwriting expense ratio .............................. 30.8 30.6 29.4
GAAP combined ratio ................................. 87.4% 88.1% 101.3%
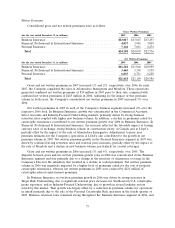
The Company’s discussions of income from continuing operations, loss from discontinued
operations, net income and segment operating income included in the following discussion are
presented on an after-tax basis. Discussions of the components of net income and segment operating
income are presented on a pretax basis, unless otherwise noted. Discussions of earnings per common
share are presented on a diluted basis.
Overview
Income from continuing operations of $6.86 per common share in 2007 was 16% higher than the
$5.91 per common share in 2006. Income from continuing operations in 2007 totaled $4.60 billion, 9%
higher than $4.21 billion in 2006. The higher rate of growth in per share income compared with the
rate of growth in actual income in 2007 over 2006 reflected the impact of the Company’s significant
common share repurchases since its repurchase program began in the second quarter of 2006. The
increase in income from continuing operations in 2007 reflected growth in net investment income, a
higher level of net favorable prior year reserve development, an increase in net realized investment
69