Travelers 2007 Annual Report Download - page 145
Download and view the complete annual report
Please find page 145 of the 2007 Travelers annual report below. You can navigate through the pages in the report by either clicking on the pages listed below, or by using the keyword search tool below to find specific information within the annual report.-
 1
1 -
 2
2 -
 3
3 -
 4
4 -
 5
5 -
 6
6 -
 7
7 -
 8
8 -
 9
9 -
 10
10 -
 11
11 -
 12
12 -
 13
13 -
 14
14 -
 15
15 -
 16
16 -
 17
17 -
 18
18 -
 19
19 -
 20
20 -
 21
21 -
 22
22 -
 23
23 -
 24
24 -
 25
25 -
 26
26 -
 27
27 -
 28
28 -
 29
29 -
 30
30 -
 31
31 -
 32
32 -
 33
33 -
 34
34 -
 35
35 -
 36
36 -
 37
37 -
 38
38 -
 39
39 -
 40
40 -
 41
41 -
 42
42 -
 43
43 -
 44
44 -
 45
45 -
 46
46 -
 47
47 -
 48
48 -
 49
49 -
 50
50 -
 51
51 -
 52
52 -
 53
53 -
 54
54 -
 55
55 -
 56
56 -
 57
57 -
 58
58 -
 59
59 -
 60
60 -
 61
61 -
 62
62 -
 63
63 -
 64
64 -
 65
65 -
 66
66 -
 67
67 -
 68
68 -
 69
69 -
 70
70 -
 71
71 -
 72
72 -
 73
73 -
 74
74 -
 75
75 -
 76
76 -
 77
77 -
 78
78 -
 79
79 -
 80
80 -
 81
81 -
 82
82 -
 83
83 -
 84
84 -
 85
85 -
 86
86 -
 87
87 -
 88
88 -
 89
89 -
 90
90 -
 91
91 -
 92
92 -
 93
93 -
 94
94 -
 95
95 -
 96
96 -
 97
97 -
 98
98 -
 99
99 -
 100
100 -
 101
101 -
 102
102 -
 103
103 -
 104
104 -
 105
105 -
 106
106 -
 107
107 -
 108
108 -
 109
109 -
 110
110 -
 111
111 -
 112
112 -
 113
113 -
 114
114 -
 115
115 -
 116
116 -
 117
117 -
 118
118 -
 119
119 -
 120
120 -
 121
121 -
 122
122 -
 123
123 -
 124
124 -
 125
125 -
 126
126 -
 127
127 -
 128
128 -
 129
129 -
 130
130 -
 131
131 -
 132
132 -
 133
133 -
 134
134 -
 135
135 -
 136
136 -
 137
137 -
 138
138 -
 139
139 -
 140
140 -
 141
141 -
 142
142 -
 143
143 -
 144
144 -
 145
145 -
 146
146 -
 147
147 -
 148
148 -
 149
149 -
 150
150 -
 151
151 -
 152
152 -
 153
153 -
 154
154 -
 155
155 -
 156
156 -
 157
157 -
 158
158 -
 159
159 -
 160
160 -
 161
161 -
 162
162 -
 163
163 -
 164
164 -
 165
165 -
 166
166 -
 167
167 -
 168
168 -
 169
169 -
 170
170 -
 171
171 -
 172
172 -
 173
173 -
 174
174 -
 175
175 -
 176
176 -
 177
177 -
 178
178 -
 179
179 -
 180
180 -
 181
181 -
 182
182 -
 183
183 -
 184
184 -
 185
185 -
 186
186 -
 187
187 -
 188
188 -
 189
189 -
 190
190 -
 191
191 -
 192
192 -
 193
193 -
 194
194 -
 195
195 -
 196
196 -
 197
197 -
 198
198 -
 199
199 -
 200
200 -
 201
201 -
 202
202 -
 203
203 -
 204
204 -
 205
205 -
 206
206 -
 207
207 -
 208
208 -
 209
209 -
 210
210 -
 211
211 -
 212
212 -
 213
213 -
 214
214 -
 215
215 -
 216
216 -
 217
217 -
 218
218 -
 219
219 -
 220
220 -
 221
221 -
 222
222 -
 223
223 -
 224
224 -
 225
225 -
 226
226 -
 227
227 -
 228
228 -
 229
229 -
 230
230 -
 231
231 -
 232
232 -
 233
233 -
 234
234 -
 235
235 -
 236
236 -
 237
237 -
 238
238 -
 239
239 -
 240
240 -
 241
241 -
 242
242 -
 243
243 -
 244
244 -
 245
245 -
 246
246 -
 247
247 -
 248
248 -
 249
249 -
 250
250 -
 251
251 -
 252
252 -
 253
253 -
 254
254 -
 255
255 -
 256
256 -
 257
257 -
 258
258 -
 259
259 -
 260
260 -
 261
261 -
 262
262 -
 263
263 -
 264
264 -
 265
265 -
 266
266 -
 267
267 -
 268
268 -
 269
269 -
 270
270 -
 271
271 -
 272
272 -
 273
273 -
 274
274 -
 275
275 -
 276
276 -
 277
277 -
 278
278 -
 279
279 -
 280
280
 |
 |

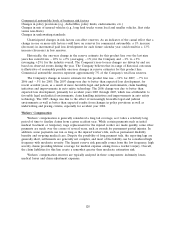
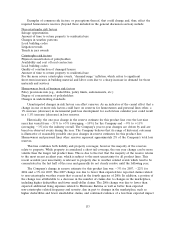
Examples of common risk factors, or perceptions thereof, that could change and, thus, affect the
required homeowners reserves (beyond those included in the general discussion section) include:
Non-catastrophe risk factors
Salvage opportunities
Amount of time to return property to residential use
Changes in weather patterns
Local building codes
Litigation trends
Trends in jury awards
Catastrophe risk factors
Physical concentration of policyholders
Availability and cost of local contractors
Local building codes
Quality of construction of damaged homes
Amount of time to return property to residential use
For the more severe catastrophic events, ‘‘demand surge’’ inflation, which refers to significant
short-term increases in building material and labor costs due to a sharp increase in demand for those
materials and services
Homeowners book of business risk factors
Policy provisions mix (e.g., deductibles, policy limits, endorsements, etc.)
Degree of concentration of policyholders
Changes in underwriting standards
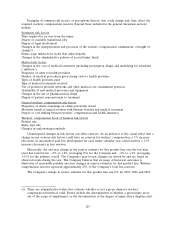
Unanticipated changes in risk factors can affect reserves. As an indicator of the causal effect that a
change in one or more risk factors could have on reserves for homeowners and personal lines other, a
1% increase (decrease) in incremental paid loss development for each future calendar year could result
in a 1.1% increase (decrease) in loss reserves.
Historically, the one-year change in the reserve estimate for this product line over the last nine
years has varied from 31% to +3% (averaging 10%) for the Company and 9% to +11%
(averaging 3%) for the industry overall. The Company’s year-to-year changes are driven by and are
based on observed events during the year. The Company believes that its range of historical outcomes
is illustrative of reasonably possible one-year changes in reserve estimates for this product line.
Homeowners and personal lines other reserves represent approximately 2% of the Company’s total loss
reserves.
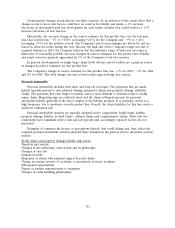
This line combines both liability and property coverages; however the majority of the reserves
relate to property. While property is considered a short tail coverage, the one year change can be more
volatile than the longer tail product lines. This is due to the fact that the majority of the reserve relates
to the most recent accident year, which is subject to the most uncertainty for all product lines. This
recent accident year uncertainty is relevant to property due to weather related events which tend to be
concentrated in the last half of the year and generally do not clearly resolve until the following year.
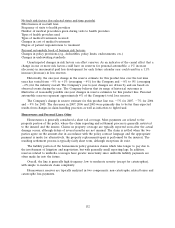
The Company’s change in reserve estimate for this product line was 3% for 2007, 22% for
2006 and +3% for 2005. The 2007 change was due to fewer than expected late reported claims related
to non-catastrophe weather events that occurred in the fourth quarter of 2006. In addition, a portion of
the change was attributable to a decrease in the number of claims due to changes in the marketplace,
including higher deductibles and fewer small-dollar claims. The 2006 change was due to lower than
expected additional living expenses related to Hurricane Katrina as well as better than expected
non-catastrophe related frequency and severity, due in part to changes in the marketplace, such as
higher deductibles and fewer small-dollar claims, and continued evidence of a less than expected impact
133
