Travelers 2007 Annual Report Download - page 101
Download and view the complete annual report
Please find page 101 of the 2007 Travelers annual report below. You can navigate through the pages in the report by either clicking on the pages listed below, or by using the keyword search tool below to find specific information within the annual report.-
 1
1 -
2
-
3
-
4
-
5
-
6
-
7
-
8
-
9
-
10
-
11
-
12
-
13
-
14
-
15
-
16
-
17
-
18
-
19
-
20
-
21
-
22
-
23
-
24
-
25
-
26
-
27
-
28
-
29
-
30
-
31
-
32
-
33
-
34
-
35
-
36
-
37
-
38
-
39
-
40
-
41
-
42
-
43
-
44
-
45
-
46
-
47
-
48
-
49
-
50
-
51
-
52
-
53
-
54
-
55
-
56
-
57
-
58
-
59
-
60
-
61
-
62
-
63
-
64
-
65
-
66
-
67
-
68
-
69
-
70
-
71
-
72
-
73
-
74
-
75
-
76
-
77
-
78
-
79
-
80
-
81
-
82
-
83
-
84
-
85
-
86
-
87
-
88
-
89
-
90
-
 91
91 -
 92
92 -
 93
93 -
 94
94 -
 95
95 -
 96
96 -
 97
97 -
 98
98 -
 99
99 -
 100
100 -
 101
101 -
 102
102 -
 103
103 -
 104
104 -
 105
105 -
 106
106 -
 107
107 -
 108
108 -
 109
109 -
 110
110 -
 111
111 -
112
-
113
-
114
-
115
-
116
-
117
-
118
-
119
-
120
-
121
-
122
-
123
-
124
-
125
-
126
-
127
-
128
-
129
-
130
-
131
-
132
-
133
-
134
-
135
-
136
-
137
-
138
-
139
-
140
-
141
-
142
-
143
-
144
-
145
-
146
-
147
-
148
-
149
-
150
-
151
-
152
-
153
-
154
-
155
-
156
-
157
-
158
-
159
-
160
-
161
-
162
-
163
-
164
-
165
-
166
-
167
-
168
-
169
-
170
-
171
-
172
-
173
-
174
-
175
-
176
-
177
-
178
-
179
-
180
-
181
-
182
-
183
-
184
-
185
-
186
-
187
-
188
-
189
-
190
-
191
-
192
-
193
-
194
-
195
-
196
-
197
-
198
-
199
-
200
-
201
-
202
-
203
-
204
-
205
-
206
-
207
-
208
-
209
-
210
-
211
-
212
-
213
-
214
-
215
-
216
-
217
-
218
-
219
-
220
-
221
-
222
-
223
-
224
-
225
-
226
-
227
-
228
-
229
-
230
-
231
-
232
-
233
-
234
-
235
-
236
-
237
-
238
-
239
-
240
-
241
-
242
-
243
-
244
-
245
-
246
-
247
-
248
-
249
-
250
-
251
-
252
-
253
-
254
-
255
-
256
-
257
-
258
-
259
-
260
-
261
-
262
-
263
-
264
-
265
-
266
-
267
-
268
-
269
-
270
-
271
-
272
-
273
-
274
-
275
-
276
-
277
-
278
-
279
-
280
 |
 |

expense ratio of 28.3%, reflecting the impact of continued investments to support business growth and
product development. The underwriting expense ratio of 28.3% in 2006 was 1.4 points higher than the
2005 expense ratio of 26.9%, primarily reflecting the impact of the increase in general and
administrative expenses in 2006 described above, and a slight increase in commission expenses. In 2005,
reinstatement premiums related to catastrophe losses reduced earned premium volume by $21 million,
and catastrophe-related assessments from various insurance pools increased taxes, licenses and fees by
$25 million. These factors combined to result in a 0.5 point unfavorable impact on the Personal
Insurance segment’s 2005 underwriting expense ratio.
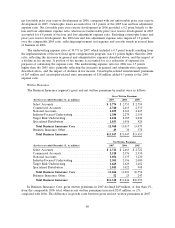
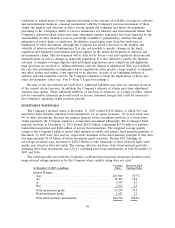
Written Premiums
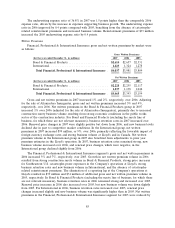
The Personal Insurance segment’s gross and net written premiums by product line were as follows:
Gross Written Premiums
(for the year ended December 31, in millions) 2007 2006 2005
Automobile .................................. $3,673 $3,731 $3,526
Homeowners and Other ......................... 3,471 3,280 2,948
Total Personal Insurance ....................... $7,144 $7,011 $6,474
Net Written Premiums
(for the year ended December 31, in millions) 2007 2006 2005
Automobile .................................. $3,628 $3,692 $3,477
Homeowners and Other ......................... 3,207 3,019 2,751
Total Personal Insurance ....................... $6,835 $6,711 $6,228
Gross and net written premiums in 2007 both increased 2% over the respective totals in 2006.
Adjusting for the sale of Mendota in both years, net written premiums in the Personal Insurance
segment in 2007 increased 4% over 2006, driven by continued strong retention rates and increases in
renewal price changes, partially offset by a decline in new business volume. Gross and net written
premiums in 2006 increased 8% over 2005. Net written premium volume in 2006 reflected increased
costs for property catastrophe coverage (which reduces net written premiums), while net written
premiums in 2005 were reduced by $21 million of catastrophe-related reinstatement premiums.
In the Automobile line of business, net written premiums in 2007 declined 2%, from 2006.
Adjusting for the impact of the sale of Mendota, net written premiums in the Automobile line of
business in 2007 increased 2% over 2006. That growth primarily reflected renewal price change
increases coupled with continued strong retention rates, partially offset by a decline in new business
volume due to competitive market conditions. The Company’s multivariate pricing product in the
Automobile line of business had been introduced in 39 states and the District of Columbia by the end
of 2007. In 2006, net written premium growth of 6% over 2005 in the Automobile line of business
primarily reflected a strong increase in new business, partially offset by the impact of transitioning to
six-month policy terms in the second half of the year for the Company’s multivariate pricing product
that resulted in a lower amount of reported net written premiums in 2006. Business retention rates in
2006 remained strong and consistent with prior year rates. Renewal price changes in 2006 remained
positive but were slightly below those in 2005. New business volume in 2006 was significantly higher
than in 2005.
In the Homeowners and Other line of business, net written premiums in 2007 grew 6% over 2006,
primarily reflecting renewal price change increases, particularly for coastal coverages, coupled with
continued strong retention rates. New business volume in this line of business in 2007 declined from
2006, primarily driven by strategies to reduce exposure to losses on the Atlantic and Gulf coasts of the
89