Travelers 2007 Annual Report Download - page 182
Download and view the complete annual report
Please find page 182 of the 2007 Travelers annual report below. You can navigate through the pages in the report by either clicking on the pages listed below, or by using the keyword search tool below to find specific information within the annual report.-
 1
1 -
2
-
3
-
4
-
5
-
6
-
7
-
8
-
9
-
10
-
11
-
12
-
13
-
14
-
15
-
16
-
17
-
18
-
19
-
20
-
21
-
22
-
23
-
24
-
25
-
26
-
27
-
28
-
29
-
30
-
31
-
32
-
33
-
34
-
35
-
36
-
37
-
38
-
39
-
40
-
41
-
42
-
43
-
44
-
45
-
46
-
47
-
48
-
49
-
50
-
51
-
52
-
53
-
54
-
55
-
56
-
57
-
58
-
59
-
60
-
61
-
62
-
63
-
64
-
65
-
66
-
67
-
68
-
69
-
70
-
71
-
72
-
73
-
74
-
75
-
76
-
77
-
78
-
79
-
80
-
81
-
82
-
83
-
84
-
85
-
86
-
87
-
88
-
89
-
90
-
91
-
92
-
93
-
94
-
95
-
96
-
97
-
98
-
99
-
100
-
101
-
102
-
103
-
104
-
105
-
106
-
107
-
108
-
109
-
110
-
111
-
112
-
113
-
114
-
115
-
116
-
117
-
118
-
119
-
120
-
121
-
122
-
123
-
124
-
125
-
126
-
127
-
128
-
129
-
130
-
131
-
132
-
133
-
134
-
135
-
136
-
137
-
138
-
139
-
140
-
141
-
142
-
143
-
144
-
145
-
146
-
147
-
148
-
149
-
150
-
151
-
152
-
153
-
154
-
155
-
156
-
157
-
158
-
159
-
160
-
161
-
162
-
163
-
164
-
165
-
166
-
167
-
168
-
169
-
170
-
171
-
 172
172 -
 173
173 -
 174
174 -
 175
175 -
 176
176 -
 177
177 -
 178
178 -
 179
179 -
 180
180 -
 181
181 -
 182
182 -
 183
183 -
 184
184 -
 185
185 -
 186
186 -
 187
187 -
 188
188 -
 189
189 -
 190
190 -
 191
191 -
 192
192 -
193
-
194
-
195
-
196
-
197
-
198
-
199
-
200
-
201
-
202
-
203
-
204
-
205
-
206
-
207
-
208
-
209
-
210
-
211
-
212
-
213
-
214
-
215
-
216
-
217
-
218
-
219
-
220
-
221
-
222
-
223
-
224
-
225
-
226
-
227
-
228
-
229
-
230
-
231
-
232
-
233
-
234
-
235
-
236
-
237
-
238
-
239
-
240
-
241
-
242
-
243
-
244
-
245
-
246
-
247
-
248
-
249
-
250
-
251
-
252
-
253
-
254
-
255
-
256
-
257
-
258
-
259
-
260
-
261
-
262
-
263
-
264
-
265
-
266
-
267
-
268
-
269
-
270
-
271
-
272
-
273
-
274
-
275
-
276
-
277
-
278
-
279
-
280
 |
 |

THE TRAVELERS COMPANIES, INC. AND SUBSIDIARIES
NOTES TO CONSOLIDATED FINANCIAL STATEMENTS (Continued)
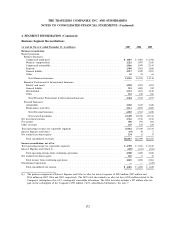
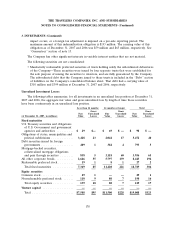
2. SEGMENT INFORMATION (Continued)
The following tables summarize the components of the Company’s revenues, operating income and
total assets by reportable business segments:
Financial,
Professional & Total
(at and for the year ended Business International Personal Reportable
December 31, in millions) Insurance Insurance Insurance Segments
2007
Premiums .................................. $11,283 $3,384 $6,803 $21,470
Net investment income ........................ 2,708 494 559 3,761
Fee income ................................. 508 — — 508
Other revenues .............................. 24 29 90 143
Total operating revenues(1) .................... $14,523 $3,907 $7,452 $25,882
Amortization and depreciation ................... $ 2,278 $ 781 $1,448 $ 4,507
Income tax expense ........................... 1,064 251 437 1,752
Operating income(1) .......................... 3,015 675 1,019 4,709
2006
Premiums .................................. $10,876 $3,321 $6,563 $20,760
Net investment income ........................ 2,538 429 548 3,515
Fee income ................................. 591 — — 591
Other revenues .............................. 44 26 94 164
Total operating revenues(1) .................... $14,049 $3,776 $7,205 $25,030
Amortization and depreciation ................... $ 2,109 $ 769 $1,282 $ 4,160
Income tax expense ........................... 918 199 518 1,635
Operating income(1) .......................... 2,622 609 1,132 4,363
2005
Premiums .................................. $11,116 $3,197 $6,028 $20,341
Net investment income ........................ 2,341 360 457 3,158
Fee income ................................. 663 1 — 664
Other revenues .............................. 64 20 96 180
Total operating revenues(1) .................... $14,184 $3,578 $6,581 $24,343
Amortization and depreciation ................... $ 2,053 $ 764 $1,141 $ 3,958
Income tax expense ........................... 172 226 342 740
Operating income(1) .......................... 1,044 391 775 2,210
(1) Operating revenues for reportable business segments exclude net realized investment gains (losses)
and revenues from discontinued operations. Operating income for reportable business segments
equals net income excluding the after-tax impact of net realized investment gains (losses) and the
after-tax impact of discontinued operations.
170