Travelers 2007 Annual Report Download - page 91
Download and view the complete annual report
Please find page 91 of the 2007 Travelers annual report below. You can navigate through the pages in the report by either clicking on the pages listed below, or by using the keyword search tool below to find specific information within the annual report.-
 1
1 -
2
-
3
-
4
-
5
-
6
-
7
-
8
-
9
-
10
-
11
-
12
-
13
-
14
-
15
-
16
-
17
-
18
-
19
-
20
-
21
-
22
-
23
-
24
-
25
-
26
-
27
-
28
-
29
-
30
-
31
-
32
-
33
-
34
-
35
-
36
-
37
-
38
-
39
-
40
-
41
-
42
-
43
-
44
-
45
-
46
-
47
-
48
-
49
-
50
-
51
-
52
-
53
-
54
-
55
-
56
-
57
-
58
-
59
-
60
-
61
-
62
-
63
-
64
-
65
-
66
-
67
-
68
-
69
-
70
-
71
-
72
-
73
-
74
-
75
-
76
-
77
-
78
-
79
-
80
-
 81
81 -
 82
82 -
 83
83 -
 84
84 -
 85
85 -
 86
86 -
 87
87 -
 88
88 -
 89
89 -
 90
90 -
 91
91 -
 92
92 -
 93
93 -
 94
94 -
 95
95 -
 96
96 -
 97
97 -
 98
98 -
 99
99 -
 100
100 -
 101
101 -
102
-
103
-
104
-
105
-
106
-
107
-
108
-
109
-
110
-
111
-
112
-
113
-
114
-
115
-
116
-
117
-
118
-
119
-
120
-
121
-
122
-
123
-
124
-
125
-
126
-
127
-
128
-
129
-
130
-
131
-
132
-
133
-
134
-
135
-
136
-
137
-
138
-
139
-
140
-
141
-
142
-
143
-
144
-
145
-
146
-
147
-
148
-
149
-
150
-
151
-
152
-
153
-
154
-
155
-
156
-
157
-
158
-
159
-
160
-
161
-
162
-
163
-
164
-
165
-
166
-
167
-
168
-
169
-
170
-
171
-
172
-
173
-
174
-
175
-
176
-
177
-
178
-
179
-
180
-
181
-
182
-
183
-
184
-
185
-
186
-
187
-
188
-
189
-
190
-
191
-
192
-
193
-
194
-
195
-
196
-
197
-
198
-
199
-
200
-
201
-
202
-
203
-
204
-
205
-
206
-
207
-
208
-
209
-
210
-
211
-
212
-
213
-
214
-
215
-
216
-
217
-
218
-
219
-
220
-
221
-
222
-
223
-
224
-
225
-
226
-
227
-
228
-
229
-
230
-
231
-
232
-
233
-
234
-
235
-
236
-
237
-
238
-
239
-
240
-
241
-
242
-
243
-
244
-
245
-
246
-
247
-
248
-
249
-
250
-
251
-
252
-
253
-
254
-
255
-
256
-
257
-
258
-
259
-
260
-
261
-
262
-
263
-
264
-
265
-
266
-
267
-
268
-
269
-
270
-
271
-
272
-
273
-
274
-
275
-
276
-
277
-
278
-
279
-
280
 |
 |
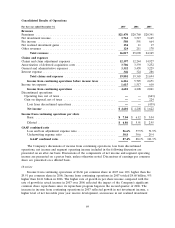
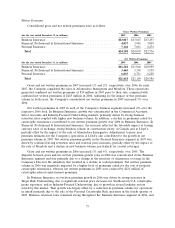
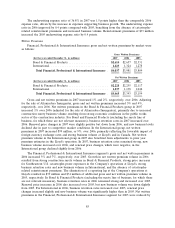
and catastrophe losses. ‘‘Demand surge’’ refers to significant short-term increases in building material
and labor costs due to a sharp increase in demand for those materials and services. The commercial
automobile line of business experienced better than expected loss development which was attributable
to more favorable legal and judicial environments, claim handling initiatives focused on the automobile
line of insurance and improvements in auto safety technology. The reserve strengthening in assumed
reinsurance was primarily due to changes in projected loss development driven by an unanticipated
change in the claim settlement patterns of the underlying casualty exposures.
Claims and claim adjustment expenses of $6.85 billion in 2006 were $2.51 billion lower than the
2005 total of $9.36 billion, primarily due to a significant decline in catastrophe losses and net favorable
prior year reserve development in 2006 compared with net unfavorable prior year reserve development
in 2005. No catastrophe losses were incurred in 2006, whereas 2005 included catastrophe losses of
$1.32 billion, nearly all of which resulted from Hurricanes Katrina, Rita and Wilma.
Net favorable prior year reserve development totaled $21 million in 2006, the components of which
are described above. In 2005, net unfavorable prior year reserve development of $757 million was
driven by an increase to asbestos reserves of $830 million and reserve strengthening for environmental
claims and runoff assumed reinsurance business. Those increases were partially offset by favorable prior
year reserve development from lower frequency and severity for both casualty and property-related
lines of business, which were driven by increasingly favorable legal and judicial environments, coupled
with better than expected results from changes in policy provisions as well as underwriting and pricing
criteria. Company initiatives relating to claims handling, which affected claims staffing and workflows,
also are believed to have contributed to the emergence of favorable severity experience in 2005.
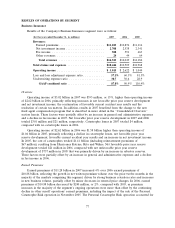
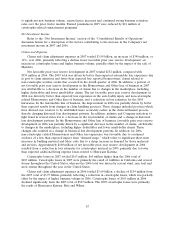
The amortization of deferred acquisition costs totaled $1.74 billion in 2007, 13% higher than the
comparable 2006 total of $1.55 billion. The increase reflected the growth in business volume, as well as
a $108 million increase from the implementation of the new fixed agent compensation program
described in more detail in the ‘‘Consolidated Overview’’ section herein. In 2006, the amortization of
deferred amortization costs of $1.55 billion was slightly lower than the 2005 total of $1.57 billion.
General and administrative expenses in 2007 totaled $2.03 billion, 4% lower than the comparable
total of $2.10 billion in 2006. The implementation of the new fixed agent compensation program in the
first quarter of 2007 resulted in a reduction of $189 million in reported general and administrative
expenses in 2007 compared to what would have been reported under the prior contingent commission
program during those periods. That reduction was partially offset by an increase in expenses related to
growth in business volume and continuing expenditures to support business growth and product
development. The 2006 total included a provision for legal expenses related to investigations of various
business practices by certain governmental agencies.
General and administrative expenses in 2006 totaled $2.10 billion, 3% higher than the comparable
total of $2.04 billion in 2005. The increase in 2006 primarily reflected the segment’s expenditures to
support business growth and product development, the segment’s share of costs associated with the
Company’s national advertising campaign and the legal expenses described above.
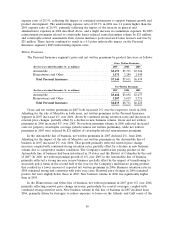
GAAP Combined Ratio
The loss and loss adjustment expense ratio of 57.1% in 2007 was 3.2 points lower than the
comparable 2006 ratio of 60.3%. In 2007, net favorable prior year reserve development provided a 2.6
point benefit to the loss and loss adjustment expense ratio, whereas the 2006 loss and loss adjustment
expense ratio included a 0.2 point benefit from net favorable prior year reserve development. Adjusting
for the impact of prior year reserve development in both years, the loss and loss adjustment expense
ratio in 2007 was 0.8 points better than the comparable 2006 ratio, reflecting continued favorable
current accident year results. The loss and loss adjustment expense ratio in 2006 improved by 21.2
points compared with the 2005 ratio of 81.5%, primarily due to the absence of catastrophe losses and
79