Travelers 2007 Annual Report Download - page 88
Download and view the complete annual report
Please find page 88 of the 2007 Travelers annual report below. You can navigate through the pages in the report by either clicking on the pages listed below, or by using the keyword search tool below to find specific information within the annual report.-
 1
1 -
2
-
3
-
4
-
5
-
6
-
7
-
8
-
9
-
10
-
11
-
12
-
13
-
14
-
15
-
16
-
17
-
18
-
19
-
20
-
21
-
22
-
23
-
24
-
25
-
26
-
27
-
28
-
29
-
30
-
31
-
32
-
33
-
34
-
35
-
36
-
37
-
38
-
39
-
40
-
41
-
42
-
43
-
44
-
45
-
46
-
47
-
48
-
49
-
50
-
51
-
52
-
53
-
54
-
55
-
56
-
57
-
58
-
59
-
60
-
61
-
62
-
63
-
64
-
65
-
66
-
67
-
68
-
69
-
70
-
71
-
72
-
73
-
74
-
75
-
76
-
77
-
 78
78 -
 79
79 -
 80
80 -
 81
81 -
 82
82 -
 83
83 -
 84
84 -
 85
85 -
 86
86 -
 87
87 -
 88
88 -
 89
89 -
 90
90 -
 91
91 -
 92
92 -
 93
93 -
 94
94 -
 95
95 -
 96
96 -
 97
97 -
 98
98 -
99
-
100
-
101
-
102
-
103
-
104
-
105
-
106
-
107
-
108
-
109
-
110
-
111
-
112
-
113
-
114
-
115
-
116
-
117
-
118
-
119
-
120
-
121
-
122
-
123
-
124
-
125
-
126
-
127
-
128
-
129
-
130
-
131
-
132
-
133
-
134
-
135
-
136
-
137
-
138
-
139
-
140
-
141
-
142
-
143
-
144
-
145
-
146
-
147
-
148
-
149
-
150
-
151
-
152
-
153
-
154
-
155
-
156
-
157
-
158
-
159
-
160
-
161
-
162
-
163
-
164
-
165
-
166
-
167
-
168
-
169
-
170
-
171
-
172
-
173
-
174
-
175
-
176
-
177
-
178
-
179
-
180
-
181
-
182
-
183
-
184
-
185
-
186
-
187
-
188
-
189
-
190
-
191
-
192
-
193
-
194
-
195
-
196
-
197
-
198
-
199
-
200
-
201
-
202
-
203
-
204
-
205
-
206
-
207
-
208
-
209
-
210
-
211
-
212
-
213
-
214
-
215
-
216
-
217
-
218
-
219
-
220
-
221
-
222
-
223
-
224
-
225
-
226
-
227
-
228
-
229
-
230
-
231
-
232
-
233
-
234
-
235
-
236
-
237
-
238
-
239
-
240
-
241
-
242
-
243
-
244
-
245
-
246
-
247
-
248
-
249
-
250
-
251
-
252
-
253
-
254
-
255
-
256
-
257
-
258
-
259
-
260
-
261
-
262
-
263
-
264
-
265
-
266
-
267
-
268
-
269
-
270
-
271
-
272
-
273
-
274
-
275
-
276
-
277
-
278
-
279
-
280
 |
 |
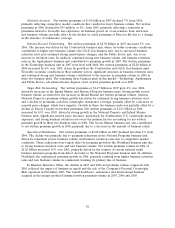
the ‘‘Liquidity and Capital Resources’’ section herein. Proceeds from a substantial portion of debt
issuances in both 2007 and 2006 were used to fund the redemption and maturity of certain of the
Company’s indebtedness.
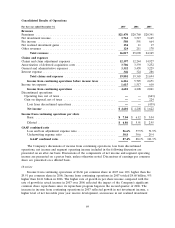
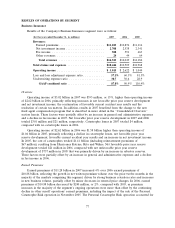
Effective Tax Rate
The Company’s effective tax rate on income from continuing operations was 26.0%, 26.5% and
22.8% in 2007, 2006 and 2005, respectively. The decline in 2007 compared with 2006 reflected an
increase in non-taxable investment income. The increase in 2006 over 2005 primarily reflected a higher
level of pretax income in 2006 due to improved underwriting performance.
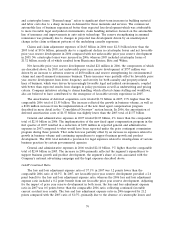
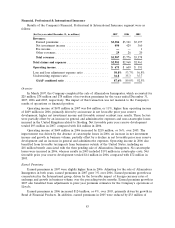
GAAP Combined Ratios
The consolidated loss and loss adjustment expense ratio of 56.6% in 2007 was 0.9 points lower
than the comparable 2006 loss and loss adjustment expense ratio of 57.5%. The 2007 and 2006 loss and
loss adjustment expense ratios included benefits of 2.5 points and 1.9 points, respectively, from net
favorable prior year reserve development. Catastrophe losses accounted for 0.7 points and 0.5 points of
the 2007 and 2006 loss and loss adjustment expense ratios. Excluding catastrophe losses and prior year
reserve development, the 2007 loss and loss adjustment expense ratio improved by 0.5 points compared
with the comparable 2006 ratio, reflecting continuing improvement in current accident year results in
several lines of business. The underwriting expense ratio of 30.8% in 2007 was 0.2 points higher than
the comparable 2006 underwriting expense ratio of 30.6%. The implementation of the new fixed agent
compensation program described above provided a benefit of 0.8 points to the expense ratios in 2007,
which was more than offset by the increases in expenses discussed above.
The consolidated loss and loss adjustment expense ratio of 57.5% in 2006 improved by 14.4 points
compared with 2005, primarily reflecting the decline in catastrophe losses. Catastrophe losses accounted
for 0.5 points of the 2006 loss and loss adjustment expense ratio, compared with a 10.3 point impact in
2005. The 2006 loss and loss adjustment expense ratio included a 1.9 point impact from net favorable
prior year reserve development, whereas the 2005 loss and loss adjustment expense ratio included a 1.6
point impact from net unfavorable prior year reserve development. The 2006 loss and loss adjustment
expense ratio excluding catastrophe losses and prior year reserve development improved over the 2005
ratio on the same basis, reflecting improvement in frequency and severity trends in several lines of
business. The underwriting expense ratio for 2006 was 1.2 points higher than the underwriting expense
ratio in 2005. The changes primarily reflect the impact of the increase in general and administrative
expenses described previously. In addition, the 2006 ratio was negatively impacted by a decline in
National Accounts’ fee income, a portion of which is accounted for as a reduction of expenses for
purposes of calculating the expense ratio. The underwriting expense ratio in 2005 also included a 0.4
point impact from reinstatement premiums and state assessments.
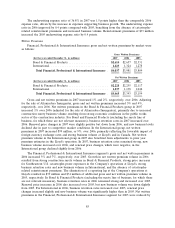
Discontinued Operations
In March 2005, the Company and Nuveen Investments jointly announced that the Company would
implement a program to divest its 78% equity interest in Nuveen Investments, which constituted the
Company’s Asset Management segment and was acquired as part of the merger on April 1, 2004. The
divestiture was completed through a series of transactions in the second and third quarters of 2005,
resulting in net pretax cash proceeds of $2.40 billion.
The Company recorded a net operating loss from discontinued operations of $663 million in 2005,
consisting primarily of $710 million of tax expense due to the difference between the tax basis and the
GAAP carrying value of the Company’s investment in Nuveen Investments, partially offset by the
Company’s share of Nuveen Investments’ net income prior to divestiture. The Company recorded a
pretax gain on disposal of $345 million ($224 million after-tax) in 2005.
76