Travelers 2007 Annual Report Download - page 17
Download and view the complete annual report
Please find page 17 of the 2007 Travelers annual report below. You can navigate through the pages in the report by either clicking on the pages listed below, or by using the keyword search tool below to find specific information within the annual report.-
 1
1 -
2
-
3
-
4
-
5
-
6
-
 7
7 -
 8
8 -
 9
9 -
 10
10 -
 11
11 -
 12
12 -
 13
13 -
 14
14 -
 15
15 -
 16
16 -
 17
17 -
 18
18 -
 19
19 -
 20
20 -
 21
21 -
 22
22 -
 23
23 -
 24
24 -
 25
25 -
 26
26 -
 27
27 -
28
-
29
-
30
-
31
-
32
-
33
-
34
-
35
-
36
-
37
-
38
-
39
-
40
-
41
-
42
-
43
-
44
-
45
-
46
-
47
-
48
-
49
-
50
-
51
-
52
-
53
-
54
-
55
-
56
-
57
-
58
-
59
-
60
-
61
-
62
-
63
-
64
-
65
-
66
-
67
-
68
-
69
-
70
-
71
-
72
-
73
-
74
-
75
-
76
-
77
-
78
-
79
-
80
-
81
-
82
-
83
-
84
-
85
-
86
-
87
-
88
-
89
-
90
-
91
-
92
-
93
-
94
-
95
-
96
-
97
-
98
-
99
-
100
-
101
-
102
-
103
-
104
-
105
-
106
-
107
-
108
-
109
-
110
-
111
-
112
-
113
-
114
-
115
-
116
-
117
-
118
-
119
-
120
-
121
-
122
-
123
-
124
-
125
-
126
-
127
-
128
-
129
-
130
-
131
-
132
-
133
-
134
-
135
-
136
-
137
-
138
-
139
-
140
-
141
-
142
-
143
-
144
-
145
-
146
-
147
-
148
-
149
-
150
-
151
-
152
-
153
-
154
-
155
-
156
-
157
-
158
-
159
-
160
-
161
-
162
-
163
-
164
-
165
-
166
-
167
-
168
-
169
-
170
-
171
-
172
-
173
-
174
-
175
-
176
-
177
-
178
-
179
-
180
-
181
-
182
-
183
-
184
-
185
-
186
-
187
-
188
-
189
-
190
-
191
-
192
-
193
-
194
-
195
-
196
-
197
-
198
-
199
-
200
-
201
-
202
-
203
-
204
-
205
-
206
-
207
-
208
-
209
-
210
-
211
-
212
-
213
-
214
-
215
-
216
-
217
-
218
-
219
-
220
-
221
-
222
-
223
-
224
-
225
-
226
-
227
-
228
-
229
-
230
-
231
-
232
-
233
-
234
-
235
-
236
-
237
-
238
-
239
-
240
-
241
-
242
-
243
-
244
-
245
-
246
-
247
-
248
-
249
-
250
-
251
-
252
-
253
-
254
-
255
-
256
-
257
-
258
-
259
-
260
-
261
-
262
-
263
-
264
-
265
-
266
-
267
-
268
-
269
-
270
-
271
-
272
-
273
-
274
-
275
-
276
-
277
-
278
-
279
-
280
 |
 |

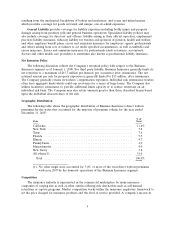
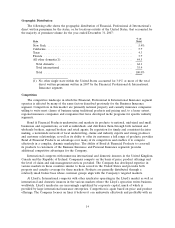
Selected Market and Product Information
The following table sets forth Business Insurance net written premiums by market and product line
for the periods indicated. For a description of the product lines and markets referred to in the table,
see ‘‘—Principal Markets and Methods of Distribution’’ and ‘‘—Product Lines,’’ respectively.
% of Total
(for the year ended December 31, in millions) 2007 2006 2005 2007
By market:
Select Accounts ............................. $ 2,711 $ 2,663 $ 2,722 24.0%
Commercial Accounts ......................... 2,518 2,376 2,330 22.2
National Accounts ........................... 1,056 1,135 1,230 9.3
Industry-Focused Underwriting .................. 2,301 2,196 2,080 20.3
Target Risk Underwriting ...................... 1,665 1,629 1,482 14.7
Specialized Distribution ....................... 1,015 1,022 908 9.0
Total Business Insurance Core ................. 11,266 11,021 10,752 99.5
Business Insurance Other ...................... 52 25 247 0.5
Total Business Insurance by market ............. $11,318 $11,046 $10,999 100.0%
By product line:
Commercial multi-peril ........................ $ 3,066 $ 3,083 $ 3,000 27.1%
Workers’ compensation ........................ 2,267 2,135 2,080 20.0
Commercial automobile ....................... 2,011 2,013 2,024 17.8
Property ................................... 1,990 1,939 1,927 17.5
General liability ............................. 1,943 1,857 1,922 17.2
Other .................................... 41 19 46 0.4
Total Business Insurance by product line ......... $11,318 $11,046 $10,999 100.0%
Principal Markets and Methods of Distribution
Business Insurance distributes its products through approximately 7,600 independent agencies and
brokers located throughout the United States that are serviced by approximately 90 field offices and
three customer service centers. Business Insurance continues to make significant investments in
enhanced technology utilizing internet-based applications to provide real-time interface capabilities with
independent agencies and brokers. Business Insurance builds relationships with well-established,
independent insurance agencies and brokers. In selecting new independent agencies and brokers to
distribute its products, Business Insurance considers, among other matters, each agency’s or broker’s
financial strength, staff experience and strategic fit with its operating and marketing plans. Once an
agency or broker is appointed, Business Insurance carefully monitors its performance.
Select Accounts is a leading provider of property casualty products to small businesses. It serves
firms with generally fewer than 50 employees. Products offered by Select Accounts are guaranteed cost
policies, including packaged products covering property and liability exposures. Products are sold
through independent agents and brokers, who are often the same agents and brokers that sell the
Company’s Commercial Accounts and Personal Insurance products.
Select Accounts offers its independent agents a system for small businesses that helps them
connect all aspects of sales and service through a comprehensive service platform. Components of the
platform include agency automation capabilities and service centers that function as an extension of an
agency’s customer service operations, both of which are highly utilized by agencies. Agencies accounting
for approximately 48% of this group’s net written premium have chosen to take advantage of Select
Accounts’ service centers, which offer agencies a wide range of services, including coverage and billing
5