Travelers 2007 Annual Report Download - page 222
Download and view the complete annual report
Please find page 222 of the 2007 Travelers annual report below. You can navigate through the pages in the report by either clicking on the pages listed below, or by using the keyword search tool below to find specific information within the annual report.-
 1
1 -
2
-
3
-
4
-
5
-
6
-
7
-
8
-
9
-
10
-
11
-
12
-
13
-
14
-
15
-
16
-
17
-
18
-
19
-
20
-
21
-
22
-
23
-
24
-
25
-
26
-
27
-
28
-
29
-
30
-
31
-
32
-
33
-
34
-
35
-
36
-
37
-
38
-
39
-
40
-
41
-
42
-
43
-
44
-
45
-
46
-
47
-
48
-
49
-
50
-
51
-
52
-
53
-
54
-
55
-
56
-
57
-
58
-
59
-
60
-
61
-
62
-
63
-
64
-
65
-
66
-
67
-
68
-
69
-
70
-
71
-
72
-
73
-
74
-
75
-
76
-
77
-
78
-
79
-
80
-
81
-
82
-
83
-
84
-
85
-
86
-
87
-
88
-
89
-
90
-
91
-
92
-
93
-
94
-
95
-
96
-
97
-
98
-
99
-
100
-
101
-
102
-
103
-
104
-
105
-
106
-
107
-
108
-
109
-
110
-
111
-
112
-
113
-
114
-
115
-
116
-
117
-
118
-
119
-
120
-
121
-
122
-
123
-
124
-
125
-
126
-
127
-
128
-
129
-
130
-
131
-
132
-
133
-
134
-
135
-
136
-
137
-
138
-
139
-
140
-
141
-
142
-
143
-
144
-
145
-
146
-
147
-
148
-
149
-
150
-
151
-
152
-
153
-
154
-
155
-
156
-
157
-
158
-
159
-
160
-
161
-
162
-
163
-
164
-
165
-
166
-
167
-
168
-
169
-
170
-
171
-
172
-
173
-
174
-
175
-
176
-
177
-
178
-
179
-
180
-
181
-
182
-
183
-
184
-
185
-
186
-
187
-
188
-
189
-
190
-
191
-
192
-
193
-
194
-
195
-
196
-
197
-
198
-
199
-
200
-
201
-
202
-
203
-
204
-
205
-
206
-
207
-
208
-
209
-
210
-
211
-
 212
212 -
 213
213 -
 214
214 -
 215
215 -
 216
216 -
 217
217 -
 218
218 -
 219
219 -
 220
220 -
 221
221 -
 222
222 -
 223
223 -
 224
224 -
 225
225 -
 226
226 -
 227
227 -
 228
228 -
 229
229 -
 230
230 -
 231
231 -
 232
232 -
233
-
234
-
235
-
236
-
237
-
238
-
239
-
240
-
241
-
242
-
243
-
244
-
245
-
246
-
247
-
248
-
249
-
250
-
251
-
252
-
253
-
254
-
255
-
256
-
257
-
258
-
259
-
260
-
261
-
262
-
263
-
264
-
265
-
266
-
267
-
268
-
269
-
270
-
271
-
272
-
273
-
274
-
275
-
276
-
277
-
278
-
279
-
280
 |
 |

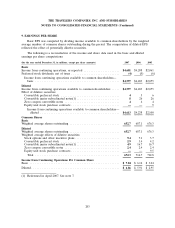
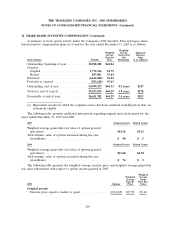
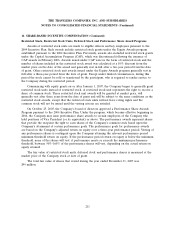
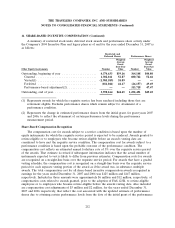
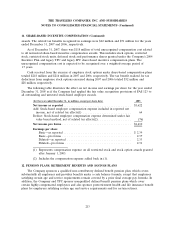
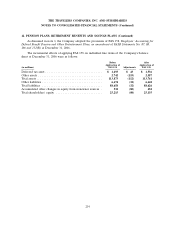
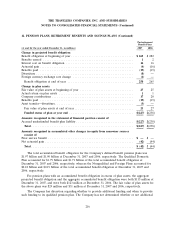
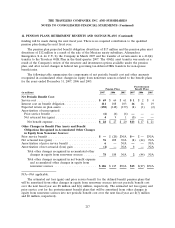
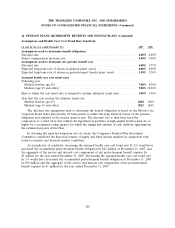
THE TRAVELERS COMPANIES, INC. AND SUBSIDIARIES
NOTES TO CONSOLIDATED FINANCIAL STATEMENTS (Continued)
11. SHARE-BASED INCENTIVE COMPENSATION (Continued)
A summary of stock option activity under the Company’s 2004 Incentive Plan and legacy share-
based incentive compensation plans as of and for the year ended December 31, 2007 is as follows:
Weighted
Weighted Average Aggregate
Average Contractual Intrinsic
Exercise Life Value
Stock Options Number Price Remaining ($ in millions)
Outstanding, beginning of year ........... 38,980,408 $42.84
Granted:
Original ......................... 1,772,516 52.79
Reload .......................... 897,001 53.64
Exercised .......................... (6,166,980) 38.22
Forfeited or expired .................. (983,618) 47.63
Outstanding, end of year ............... 34,499,327 $44.33 4.5 years $327
Vested at end of year(1) ............... 29,227,035 $44.29 3.9 years $278
Exercisable at end of year .............. 26,621,702 $44.29 3.6 years $253
(1) Represents awards for which the requisite service has been rendered including those that are
retirement eligible.
The following table presents additional information regarding original and reload grants for the
years ended December 31, 2007 and 2006.
2007 Original Grants Reload Grants
Weighted average grant-date fair value of options granted
(per share) ..................................... $14.36 $5.31
Total intrinsic value of options exercised during the year
(in millions) ..................................... $90 $5
2006 Original Grants Reload Grants
Weighted average grant-date fair value of options granted
(per share) ..................................... $13.60 $4.94
Total intrinsic value of options exercised during the year
(in millions) ..................................... $74 $5
The following table presents the weighted average exercise price and weighted average grant-date
fair value information with respect to option awards granted in 2005:
Weighted
Weighted Average
Average Grant
Exercise Date Fair
2005 Options Price Value
Original awards
Exercise price equal to market at grant ............... 4,961,029 $37.78 $9.10
210