Travelers 2007 Annual Report Download - page 158
Download and view the complete annual report
Please find page 158 of the 2007 Travelers annual report below. You can navigate through the pages in the report by either clicking on the pages listed below, or by using the keyword search tool below to find specific information within the annual report.-
 1
1 -
2
-
3
-
4
-
5
-
6
-
7
-
8
-
9
-
10
-
11
-
12
-
13
-
14
-
15
-
16
-
17
-
18
-
19
-
20
-
21
-
22
-
23
-
24
-
25
-
26
-
27
-
28
-
29
-
30
-
31
-
32
-
33
-
34
-
35
-
36
-
37
-
38
-
39
-
40
-
41
-
42
-
43
-
44
-
45
-
46
-
47
-
48
-
49
-
50
-
51
-
52
-
53
-
54
-
55
-
56
-
57
-
58
-
59
-
60
-
61
-
62
-
63
-
64
-
65
-
66
-
67
-
68
-
69
-
70
-
71
-
72
-
73
-
74
-
75
-
76
-
77
-
78
-
79
-
80
-
81
-
82
-
83
-
84
-
85
-
86
-
87
-
88
-
89
-
90
-
91
-
92
-
93
-
94
-
95
-
96
-
97
-
98
-
99
-
100
-
101
-
102
-
103
-
104
-
105
-
106
-
107
-
108
-
109
-
110
-
111
-
112
-
113
-
114
-
115
-
116
-
117
-
118
-
119
-
120
-
121
-
122
-
123
-
124
-
125
-
126
-
127
-
128
-
129
-
130
-
131
-
132
-
133
-
134
-
135
-
136
-
137
-
138
-
139
-
140
-
141
-
142
-
143
-
144
-
145
-
146
-
147
-
 148
148 -
 149
149 -
 150
150 -
 151
151 -
 152
152 -
 153
153 -
 154
154 -
 155
155 -
 156
156 -
 157
157 -
 158
158 -
 159
159 -
 160
160 -
 161
161 -
 162
162 -
 163
163 -
 164
164 -
 165
165 -
 166
166 -
 167
167 -
 168
168 -
169
-
170
-
171
-
172
-
173
-
174
-
175
-
176
-
177
-
178
-
179
-
180
-
181
-
182
-
183
-
184
-
185
-
186
-
187
-
188
-
189
-
190
-
191
-
192
-
193
-
194
-
195
-
196
-
197
-
198
-
199
-
200
-
201
-
202
-
203
-
204
-
205
-
206
-
207
-
208
-
209
-
210
-
211
-
212
-
213
-
214
-
215
-
216
-
217
-
218
-
219
-
220
-
221
-
222
-
223
-
224
-
225
-
226
-
227
-
228
-
229
-
230
-
231
-
232
-
233
-
234
-
235
-
236
-
237
-
238
-
239
-
240
-
241
-
242
-
243
-
244
-
245
-
246
-
247
-
248
-
249
-
250
-
251
-
252
-
253
-
254
-
255
-
256
-
257
-
258
-
259
-
260
-
261
-
262
-
263
-
264
-
265
-
266
-
267
-
268
-
269
-
270
-
271
-
272
-
273
-
274
-
275
-
276
-
277
-
278
-
279
-
280
 |
 |

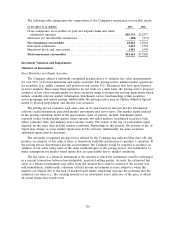
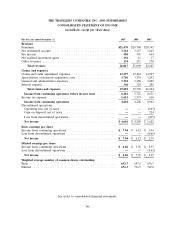
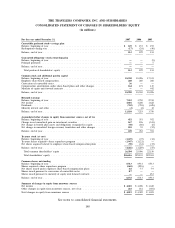
THE TRAVELERS COMPANIES, INC. AND SUBSIDIARIES
CONSOLIDATED STATEMENT OF INCOME
(in millions, except per share data)
For the year ended December 31, 2007 2006 2005
Revenues
Premiums .............................................. $21,470 $20,760 $20,341
Net investment income ..................................... 3,761 3,517 3,165
Fee income ............................................. 508 591 664
Net realized investment gains ................................ 154 11 17
Other revenues .......................................... 124 211 178
Total revenues ........................................ 26,017 25,090 24,365
Claims and expenses
Claims and claim adjustment expenses .......................... 12,397 12,244 14,927
Amortization of deferred acquisition costs ....................... 3,706 3,339 3,252
General and administrative expenses ........................... 3,352 3,458 3,229
Interest expense .......................................... 346 324 286
Total claims and expenses ............................... 19,801 19,365 21,694
Income from continuing operations before income taxes ........... 6,216 5,725 2,671
Income tax expense ....................................... 1,615 1,517 610
Income from continuing operations .......................... 4,601 4,208 2,061
Discontinued operations:
Operating loss, net of taxes ................................ —— (663)
Gain on disposal, net of taxes .............................. —— 224
Loss from discontinued operations ........................... —— (439)
Net income ............................................ $ 4,601 $ 4,208 $ 1,622
Basic earnings per share
Income from continuing operations ............................ $ 7.04 $ 6.12 $ 3.04
Loss from discontinued operations ............................ —— (0.65)
Net income ............................................ $ 7.04 $ 6.12 $ 2.39
Diluted earnings per share
Income from continuing operations ............................ $ 6.86 $ 5.91 $ 2.95
Loss from discontinued operations ............................ —— (0.62)
Net income ............................................ $ 6.86 $ 5.91 $ 2.33
Weighted average number of common shares outstanding:
Basic .................................................. 652.7 687.1 676.3
Diluted ................................................ 672.3 716.7 712.8
See notes to consolidated financial statements.
146